

FluView Interactive
 ShareCompartir

The CDC FluView report provides weekly influenza surveillance information in the United States. These applications were developed to enhance the weekly FluView report by better facilitating communication about influenza with the public health community, clinicians, scientists, and the general public. This series of dynamic visualizations allow any Internet user to access influenza information collected by CDC's monitoring systems.
Influenza surveillance data from the 1997-1998 through current season from the U.S. World Health Organization (WHO) and National Respiratory and Enteric Virus Surveillance System (NREVSS) collaborating laboratories and U.S. Outpatient Influenza-like Illness Surveillance Network (ILINet) can be accessed through the FluView Interactive website. The finalized data for previous seasons presented in FluView Interactive may differ from the preliminary data published in the weekly reports due to the receipt of additional data after publication.
FluView Interactive
- ILI and Viral Surveillance
- Hospitalizations
- ILI Activity Map
- Pediatric Mortality
- P&I Mortality
- Geographic Spread
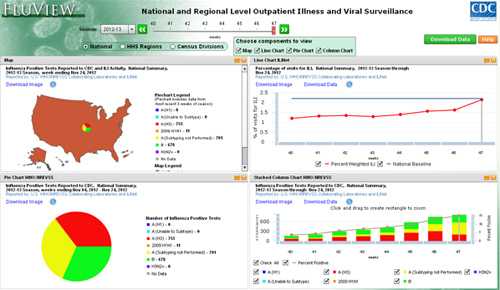
National, Regional, and State Level Outpatient Illness and Viral Surveillance
This application showcases two of CDC's influenza surveillance systems, the WHO/NREVSS Collaborating Labs and the US Outpatient Influenza-like Illness Surveillance Network (ILINet). Users are able to view both influenza laboratory data and medically attended visits for influenza-like illness (ILI) side by side for the influenza season and geography (national, regional, or select states) of interest.
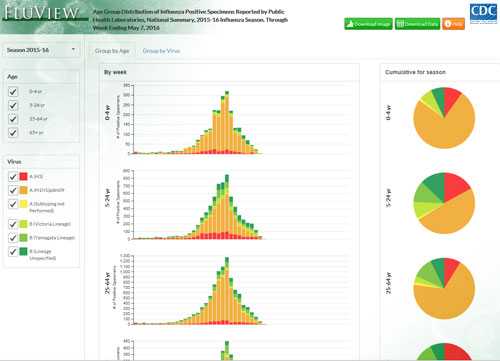
Age Group Distribution of Influenza Positive Tests Reported by Public Health Laboratories
A second application also shows the age group distribution of influenza positive tests that are reported by public health laboratories by influenza virus type and subtype/lineage. This application allows users to view laboratory data from multiple seasons and different age groups.
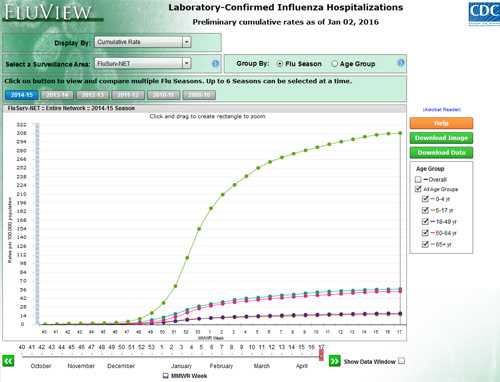
Laboratory Confirmed Influenza Hospitalizations
This application shows cumulative and weekly hospitalization rates from FluSurv-NET, a population-based surveillance network for laboratory-confirmed influenza-associated hospitalizations. This application allows users to view rates across multiple seasons and different age groups.
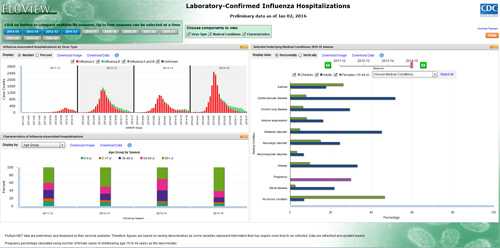
Laboratory Confirmed Influenza Hospitalizations with Characteristics
A second application also shows data from FluSurvNET but focuses on the characteristics (such as the virus type, demographic, and clinical information) of these hospitalizations.
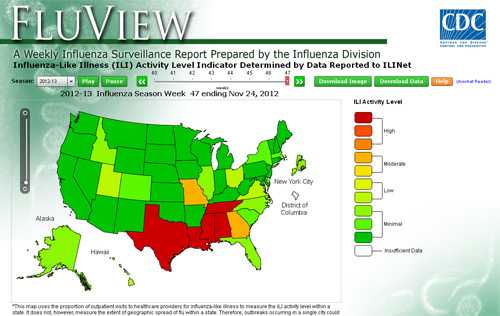
ILI Activity Indicator Map
This application shows ILI activity by state using data collected through ILINet. This interactive tool allows users to view state-specific activity levels for multiple seasons and to have a visual representation of relative activity from state to state. For more in depth state level information, users can access state influenza surveillance websites by clicking on the state.
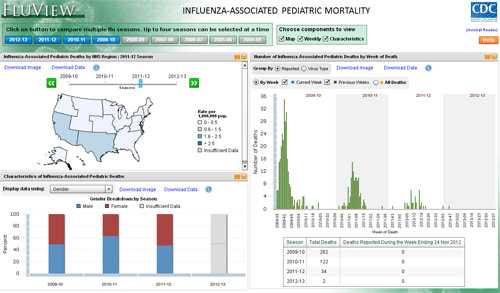
Influenza Associated Pediatric Mortality
This application shows information collected through the Influenza-Associated Pediatric Mortality Surveillance System and allows users to view case characteristics including basic demographics, underlying conditions and time and place of death.
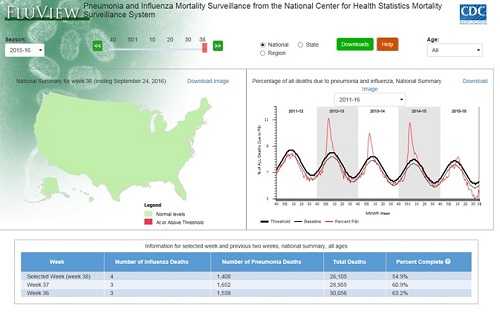
Pneumonia and Influenza Mortality Surveillance from the National Center for Health Statistics Mortality Surveillance System
This application shows national, regional, and state-level pneumonia and influenza (P&I) mortality data from the National Center for Health Statistics (NCHS) Mortality Surveillance System.
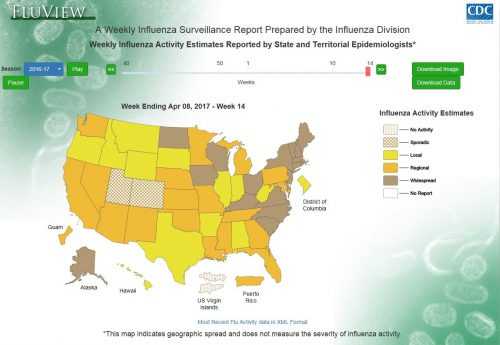
State and Territorial Epidemiologists Reports of Geographic Spread of Influenza
This application shows the influenza activity reported by state and territorial epidemiologists indicates geographic spread of influenza viruses, but doesn’t measure the severity of influenza activity.
Descargo de responsabilidad: Es posible que en este sitio encuentre algunos enlaces que le lleven a contenido disponible sólo en inglés. Además, el contenido que se ha traducido del inglés se actualiza a menudo, lo cual puede causar la aparición temporal de algunas partes en ese idioma hasta que se termine de traducir (generalmente en 24 horas). Llame al 1-800-CDC-INFO si tiene preguntas sobre la influenza estacional, cuyas respuestas no ha encontrado en este sitio. Agradecemos su paciencia.
- Page last reviewed: November 1, 2017
- Page last updated: November 1, 2017
- Content source:
- Centers for Disease Control and Prevention, National Center for Immunization and Respiratory Diseases (NCIRD)
- Page maintained by: Office of the Associate Director for Communication, Digital Media Branch, Division of Public Affairs