Skip directly to search Skip directly to A to Z list Skip directly to navigation Skip directly to page options Skip directly to site content

Tuberculosis in the United States

National Tuberculosis Surveillance System Highlights from 2012

This slide series was developed as an accompaniment to the document Reported Tuberculosis in the United States, 2012


NOTE: The slide set is in the public domain. You may reproduce these slides without permission. You are also free to adapt and revise these slides; however, you must remove the CDC name and logo if changes are made.

Slide 1 (title slide). Tuberculosis in the United States—National Tuberculosis Surveillance System, Highlights from 2012. Click here for larger imaged Slide 2. Reported TB Cases, United States, 1982–2012. Click here for larger imaged
Slide 3. TB Morbidity, United States, 2007-2012. Click here for larger imaged Slide 4. TB Case Rates, United States, 2012. Click here for larger imaged
Slide 5. Map of U.S.-Affiliated Pacific Islands by TB Case Rates, 2012. Click here for larger imaged Slide 6. TB Case Rates, U.S.-Affiliated Pacific Islands, 2012. Click here for larger imaged
Slide 7. TB Case Rates by Age Group, United States, 1993–2012. Click here for larger imaged Slide 8. Reported TB Cases by Age Group, United States, 2012. Click here for larger imaged
Slide 9. TB Case Rates by Age Group and Sex, United States, 2012. Click here for larger imaged Slide 10. TB Case Rates by Race/Ethnicity, United States, 2003–2012. Click here for larger imaged
Slide 11. TB Case Rates by Age Group and Race/Ethnicity, United States, 2012. Click here for larger imaged Slide 12. Reported TB Cases by Race/Ethnicity, United States, 2012. Click here for larger imaged
Slide 13. Number of TB Cases in U.S.-born vs. Foreign-born Persons, United States, 1993–2012. Click here for larger imaged Slide 14. Trends in TB Cases in Foreign-born Persons, United States, 1991–2012. Click here for larger imaged
Slide 15. Reported TB Cases by Origin and Race/Ethnicity, United States, 2012. Click here for larger imaged Slide 16. Percentage of TB Cases Among Foreign-born Persons, United States, 2002 and 2012. Click here for larger imaged
Slide 17. TB Case Rates in U.S.-born vs. Foreign-born Persons, United States, 1993–2012. Click here for larger imaged Slide 18. TB Case Rates in U.S.-born vs. Foreign-born Persons, United States, 1993–2012. Click here for larger imaged
Slide 19. Countries of Birth of Foreign-born Persons Reported with TB, United States, 2012. Click here for larger imaged Slide 20. Percent of Foreign-born with TB by Time of Residence in U.S. Prior to Diagnosis, 2012. Click here for larger imaged
Slide 21. Primary Anti-TB Drug Resistance, United States, 1993–2012. Click here for larger imaged Slide 22. Primary MDR TB, United States, 1993–2012. Click here for larger imaged
Slide 23. Primary Isoniazid Resistance in U.S.-born vs. Foreign-born Persons, United States, 1993–2012. Click here for larger imaged Slide 24. Primary MDR TB in U.S.-born vs. Foreign-born Persons, United States, 1993–2012. Click here for larger imaged
Slide 25. Extensively Drug Resistant (XDR) TB, as Defined on Initial Drug Susceptibility Testing (DST), United States, 1993–2012. Click here for larger imaged Slide 26. Reporting of HIV Test Results in Persons with TB by Age Group, United States, 1993–2012. Click here for larger image.d
Slide 27. Estimated HIV Coinfection in Persons Reported with TB, United States, 1993–2012. Click here for larger imaged Slide 28. TB Cases by Residence in Correctional Facilities, Age ≥15, United States, 1993-2012. Click here for larger imaged
Slide 29. TB Cases by Homeless Status, Age ≥15, United States, 1993-2012. Click here for larger imaged Slide 30. Mode of Treatment Administration in Persons Reported with TB, United States, 1993–2010. Click here for larger imaged
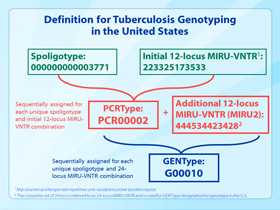
Slide 31. Completion of TB Therapy, United States, 1993–2010. Click here for larger imaged Slide 32. Definition for Tuberculosis Genotyping in the United States. Click here for larger imaged
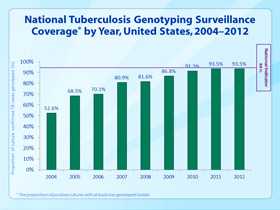
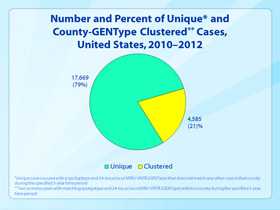
Slide 33. National Tuberculosis Genotyping Surveillance Coverage by Year, United States, 2004–2012. Click here for larger imaged Slide 34. Number and Percent of Unique and County-GENType Clustered Cases, United States, 2010–2012. Click here for larger imaged
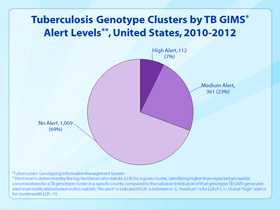
Slide 35. Number of County-based Tuberculosis Genotype Clusters by Cluster Size, United States, 2010–2012. Click here for larger imaged Slide 36. Tuberculosis Genotype Clusters by TB GIMS Alert Levels, United States, 2010-2012. Click here for larger imaged
Top