

2012 Surveillance Slides
 ShareCompartir
 |
|
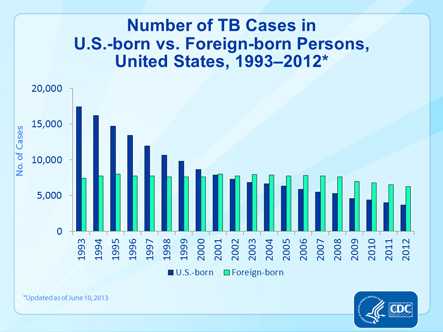
Slide 13. Number of TB Cases in U.S.-born vs. Foreign-born Persons, United States, 1993–2012. This graph plots the number of U.S.-born vs. foreign-born persons reported with TB each year, from 1993 through 2012. It illustrates the increase in the percentage of cases occurring in foreign-born persons during this period, from 29% in 1993 to 63% in 2011. Overall, the number of cases in foreign-born persons remained virtually level, with approximately 7,000–8,000 cases each year before 2009, until 2009 when the number dropped to 6,854. That decreasing trend continued in 2012 with the number of foreign-born cases dropping to 6,274. The number in U.S.-born persons decreased from more than 17,000 in 1993 to 3,659 in 2012. |
- Page last reviewed: September 11, 2013
- Page last updated: September 11, 2013
- Content source: