2012 Surveillance Slides
 |
|
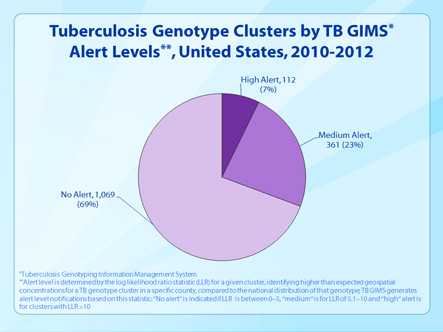
Slide 36. Tuberculosis Genotype Clusters by TB GIMS Alert Levels, United States, 2010-2012. This slide shows a chart with percentage of genotype clusters by alert level. Alert level is determined by the log likelihood ratio statistic (LLR) for a given cluster, identifying higher than expected geospatial concentrations for a TB genotype cluster in a specific county, compared to the national distribution of that genotype; TB GIMS generates alert level notifications based on this statistic: “No alert” is indicated if LLR is between 0–5, “medium” is for LLR of 5.1–10 and “high” alert is for clusters with LLR >10. In the 2010-2012 three year time period, high alerts made up 7% of the total, medium alerts were 23%, and no alert were 69%. |
- Page last reviewed: September 11, 2013
- Page last updated: September 11, 2013
- Content source:


 ShareCompartir