

Fact Sheet
 ShareCompartir
Trends in Tuberculosis, 2015
Number of TB Cases Reported in the United States in 2015 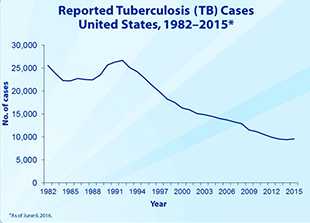
A total of 9,557 TB cases (a rate of 3.0 cases per 100,000 persons) were reported in the United States in 2015. This represents a 1.6% increase in the number of TB cases compared to cases reported in 2014. Twenty-seven states and the District of Columbia (DC) each reported an increase in TB cases from 2014. Despite the increase in the number of cases, the TB incidence rate per 100,000 persons has remained relatively stable at approximately 3.0 since 2013.
TB Deaths in the United States
There were 493 deaths from TB in 2014, the most recent year for which these data are available. This is an 11% decrease from the 555 TB deaths in 2013. Overall, the number of TB deaths reported annually has decreased by 71% since 1992.
TB Rates in U.S.-born Persons compared to Foreign-born Persons Living in the United States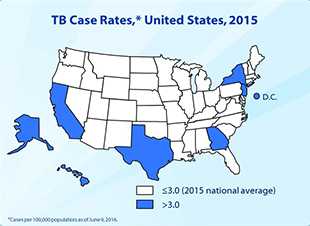
The case rate among foreign-born persons has continually decreased since 1996, and the rates for U.S.-born persons have been approximately the same for the past 3 years. In 2015, a total of 66.4% of reported TB cases in the United States occurred among foreign-born persons. The case rate among foreign-born persons (15.1 cases per 100,000 persons) was approximately 13 times higher than among U.S.-born persons (1.2 cases per 100,000 persons). The majority of these cases are among persons who have been in the United States 5 years or longer.
Rates of TB for Different Racial and Ethnic Groups
† For this report, persons identified as white, black, Asian, American Indian/Alaska Native, native Hawaiian or other Pacific Islander, or of multiple races are all non-Hispanic. Persons identified as Hispanic may be of any race.
- American Indians or Alaska Natives: 6.1 TB cases per 100,000 persons
- Asians: 18.2 TB cases per 100,000 persons
- Blacks or African Americans: 5.0 TB cases per 100,000 persons
- Native Hawaiians and other Pacific Islanders: 18.2 TB cases per 100,000 persons
- Hispanics or Latinos: 4.8 TB cases per 100,000 persons
- Whites: 0.6 TB cases per 100,000 persons
Multidrug-Resistant* TB (MDR TB)
Overall, the percentage of MDR TB cases decreased slightly from 1.3% (94 cases) in 2014 to 1.2% (89 cases) in 2015.** Of the total number of reported MDR TB cases, the proportion occurring among foreign-born persons increased from 31% (149 of 484) in 1993 to 85% (76 of 89) in 2015.
* MDR TB is defined as TB disease that is resistant to at least isoniazid and rifampin.
** Among culture-positive TB cases in the United States with initial drug-susceptibility testing results.
Completion of TB Treatment
The proportion of TB patients prescribed the recommended initial treatment regimen including isoniazid, rifampin, pyrazinamide, and ethambutol increased from 40.3% in 1993 to 84.7% in 2015. The proportion of eligible TB patients who completed treatment within 1 year increased from 63.4% in 1993 to 89.6% in 2013 (the latest year that data is available).
Eliminating TB in the U.S.
Resuming and accelerating progress toward TB elimination in the United States will require an intensified, dual approach. This includes strengthening existing systems to prevent transmission of infectious TB disease and increasing efforts to detect and treat latent TB infection in high-risk populations.
State Data
The most recent surveillance report, Reported Tuberculosis in the United States, 2015, includes data from 60 reporting areas (the 50 states, the District of Columbia, New York City, Puerto Rico, and seven other U.S. jurisdictions in the Pacific and Caribbean). The report can be found online at http://www.cdc.gov/tb/statistics/default.htm. If you need additional state-specific data not available in this report, you can contact your state TB control office: https://www.cdc.gov/tb/links/tboffices.htm.
Other resources include the
- National Center for HIV/AIDS, Viral Hepatitis, STD, and TB Prevention (NCHHSTP) Atlas (2008-2013), an interactive tool that allows users to observe trends and patterns by creating detailed reports, maps, and other graphics showing geographic patterns and time trends. Available at https://www.cdc.gov/nchhstp/atlas/.
- Online Tuberculosis Information System (OTIS), an interactive data system containing information on TB cases reported to CDC in 1993-2014. Users can select criteria to produce specific reports. Data are available by year, state, and demographic factors. Available at https://wonder.cdc.gov/tb.html.
References
CDC. CDC. Reported Tuberculosis in the United States, 2015. Atlanta, GA: U.S. Department of Health and Human Services, CDC, November 2016. Available at http://www.cdc.gov/tb/statistics/reports/2015
Additional Information
CDC. Latent TB Infection Resources
CDC. Questions and Answers About TB.
CDC. The Difference Between Latent TB Infection and TB Disease.
- Page last reviewed: October 9, 2014
- Page last updated: November 29, 2016
- Content source: