

2012 Surveillance Slides
 ShareCompartir
 |
|
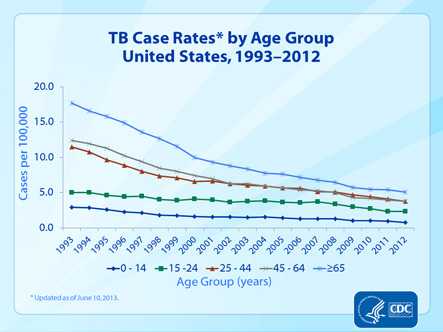
Slide 7. TB Case Rates by Age Group, United States, 1993–2012. This slide shows the last 20 years’ declining trend in TB rates by age group. In 2012, case rates in all age groups declined by more than 50% from 1993 values: persons 65 years and older (from 17.7 per 100,000 in 1993 to 5.1in 2012); adults aged 45 to 64 years (from 12.4 to 3.8); adults aged 25 to 44 years (from 11.5 to 3.8); those 15 to 24 years of age (from 5.0 to 2.3); and in children under 15 years of age (from 2.9 to 0.8) |
- Page last reviewed: September 11, 2013
- Page last updated: September 11, 2013
- Content source: