

2012 Surveillance Slides
 ShareCompartir
 |
|
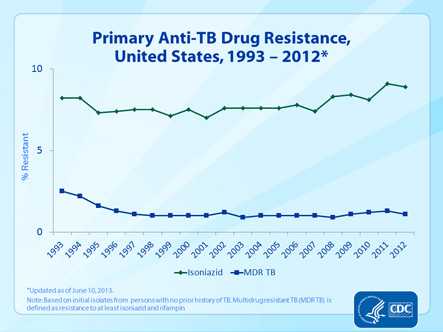
Slide 21. Primary Anti-TB Drug Resistance, United States, 1993–2012. Primary drug resistance is shown for the past 20 years. The graph starts in 1993, the year in which the individual TB case reports submitted to the national surveillance system began collecting information on initial susceptibility test results for patients with culture-positive TB. Data were available for more than 85% of culture-positive cases for each year. Primary resistance was calculated by using data from persons with no reported prior TB episode. Resistance to at least isoniazid was 8.2% in 1993; however by 2012, this had increased to 8.9%. Resistance to at least isoniazid and rifampin, known as multidrug-resistant TB (MDR TB), was 2.5% in 1993; the percent of primary MDR TB has remained approximately stable since it decreased to 1.0% in 1998. In 2012 the percent of primary MDR TB was 1.1%. |
- Page last reviewed: September 11, 2013
- Page last updated: September 11, 2013
- Content source: