

2012 Surveillance Slides
 ShareCompartir
 |
|
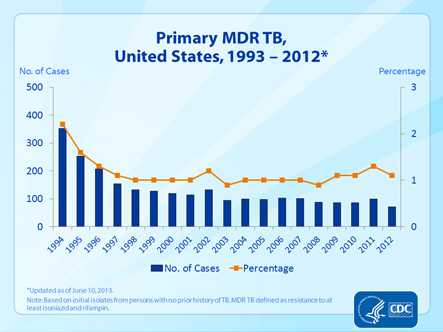
Slide 22. Primary MDR TB, United States, 1993–2012. This graph focuses on trends in primary MDR TB (based on initial isolates from persons with no prior history of TB) in the United States from 1993 through 2012. The number of primary MDR TB cases, represented by bars, steadily declined from 407 in 1993 to 132 in 2002. Since then, the total number of primary MDR TB cases has fluctuated between 87 to 103 cases, with 72 cases reported for 2012. Primary MDR TB, shown by the line, decreased from 2.5% in 1993 to approximately 1.0% in 1998, and has fluctuated around 1.0% since then. In 2012, the percentage was 1.1%. |
- Page last reviewed: September 11, 2013
- Page last updated: September 11, 2013
- Content source: