

2012 Surveillance Slides
 ShareCompartir
 |
|
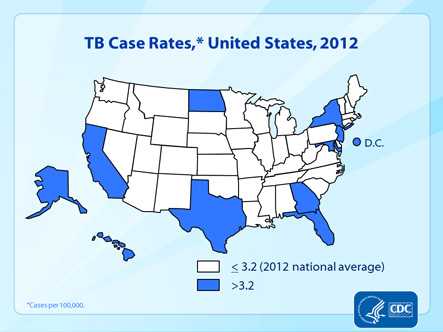
Slide 4. TB Case Rates, United States, 2012. This map shows TB rates for 2012. Forty states reported a rate less than 3.2TB cases per 100,000, the 2012 national average. Ten states and DC reported a rate above 3.2 TB cases per 100,000; these accounted for 61% of the national total in 2012 and have experienced substantial overall decreases in cases and rates from 1992 through 2012. |
- Page last reviewed: September 11, 2013
- Page last updated: September 11, 2013
- Content source: