

2012 Surveillance Slides
 ShareCompartir
 |
|
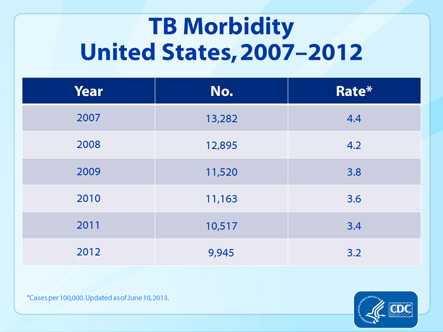
Slide 3. TB Morbidity, United States, 2007-2012. This slide provides the total number of reported U.S. TB cases and the associated rates for each of the past 6 years. Rate is defined as cases per 100,000 population. The number of TB cases decreased from 13,282 in 2007 to 9,945 in 2012, and the TB rate decreased from 4.4 in 2007 to 3.2 in 2012. |
- Page last reviewed: September 11, 2013
- Page last updated: September 11, 2013
- Content source: