

2012 Surveillance Slides
 ShareCompartir
 |
|
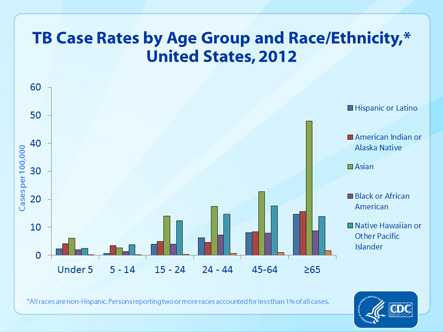
Slide 11. TB Case Rates by Age Group and Race/Ethnicity, United States, 2012. This slide presents TB rates in 2012 by age group and race/ethnicity. After infancy (age under 5), risk typically increased with age across all racial and ethnic groups. Rates were consistently higher in minority racial and ethnic groups than in non-Hispanic whites. Rates were the highest in Asians and Native Hawaiians and Other Pacific Islanders, particularly in adult age groups. |
- Page last reviewed: September 11, 2013
- Page last updated: September 11, 2013
- Content source: