

2012 Surveillance Slides
 ShareCompartir
 |
|
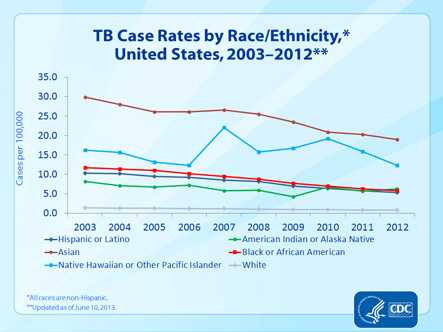
Slide 10. TB Case Rates by Race/Ethnicity, United States, 2003–2012. This slide shows the declining trend in TB rates by race/ethnicity during the last 11 years. Asians had the highest TB rates, which declined from 29.9 per 100,000 in 2003 to 18.9 in 2012, and had a percent decline over the time period of 37%. Rates also declined in the following racial/ethnic groups: among non-Hispanic blacks or African-Americans, from 11.7 in 2003 to 5.8 in 2012 (-50%); among Hispanics, from 10.3 to 5.3 (-48%); among American Indians and Alaska Natives, from 8.2 to 6.3 (-23%); and among non-Hispanic whites, from 1.4 to 0.8 (-43%). Rates also decreased among Native Hawaiian or Other Pacific Islanders, from 16.2 in 2003 to 12.3 in 2012 (-24%). Several important factors likely contribute to the disproportionate burden of TB in minorities. In persons who were born in countries where TB is common, TB disease may result from infection acquired in the country of origin. Unequal distribution of TB risk factors, such as HIV infection, may also contribute to increased exposure to TB or to an increased risk of developing TB once infected with M. tuberculosis. |
- Page last reviewed: September 11, 2013
- Page last updated: September 11, 2013
- Content source: