

2012 Surveillance Slides
 ShareCompartir
 |
|
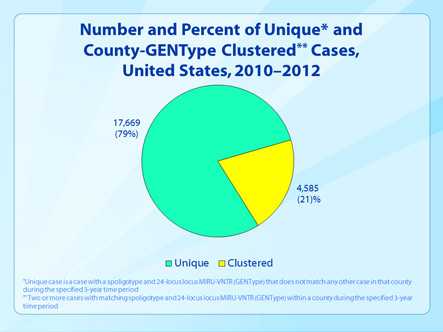
Slide 34. Number and Percent of Unique and County-GENType Clustered Cases, United States, 2010–2012. This slide shows a chart with the percentage of unique and clustered cases. Unique cases are those with a spoligotype and 24-locus locus MIRU-VNTR (GENType) that does not match any other case in that county during the specified three year time period. Clustered cases are two or more cases with matching spoligotype and 24-locus locus MIRU-VNTR (GENType) within a county during the specified three year time period. In the 2010 – 2012 three year time period, there were 79% unique cases, and 21% clustered cases. |
- Page last reviewed: September 11, 2013
- Page last updated: September 11, 2013
- Content source: