

2012 Surveillance Slides
 ShareCompartir
 |
|
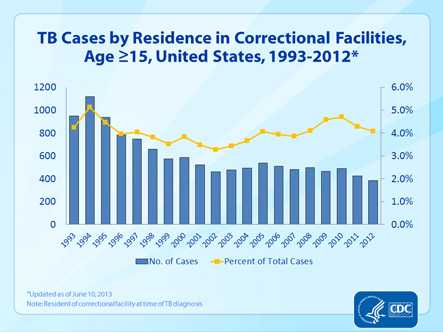
Slide 28. TB Cases by Residence in Correctional Facilities, Age ≥15, United States, 1993-2012. This graph highlights the number of cases that were a resident of any type of correctional facility at the time of TB diagnosis. Cases must have been 15 years of age or greater. The number of cases residing in a correctional facility has decreased from a high of 1,117 cases in 1994 to 384 cases in 2012. Between the years 2000 and 2010, the number of cases residing in a correctional facility ranged between the high-400s and high-500s; 2011 was the first year to drop below this range to 424 cases. Of total cases, the percentage of cases residing in a correctional facility has ranged from 5.1% in 1994 to 3.3% in 2002. The 1990s saw a decreasing trend in percentage until 2002. Since 2002, there has been an increasing trend in percentage; in 2012 the percentage of total cases was 4.1%. |
- Page last reviewed: September 11, 2013
- Page last updated: September 11, 2013
- Content source: