

Gonorrhea
 ShareCompartir
Background
Gonorrhea is the second most commonly reported notifiable disease in the United States. Infections due to Neisseria gonorrhoeae, like those resulting from Chlamydia trachomatis, are a major cause of pelvic inflammatory disease (PID) in the United States. PID can lead to serious outcomes in women, such as tubal infertility, ectopic pregnancy, and chronic pelvic pain. In addition, epidemiologic and biologic studies provide evidence that gonococcal infections facilitate the transmission of HIV infection.1 Together, sexual behavior and community prevalence can increase the risk of acquiring gonorrhea. Social determinants of health, such as socioeconomic status, discrimination, and access to quality health care, may contribute to the burden of gonorrhea in a community.2
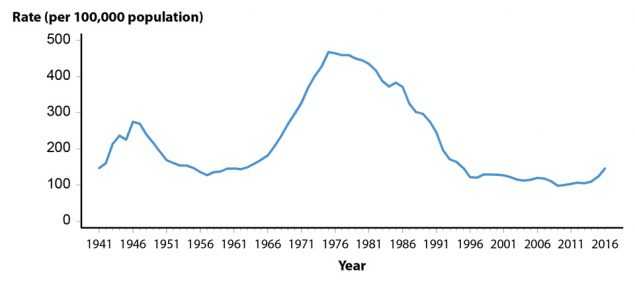
In 2009, the national rate of reported gonorrhea cases reached a historic low of 98.1 cases per 100,000 population (Figure 12, Table 1). However, during 2009–2012, the rate increased slightly each year to 106.7 cases per 100,000 population in 2012. In 2013, the rate decreased slightly to 105.3 cases per 100,000 population, followed by a yearly increase during 2013–2016. In 2016, a total of 468,514 cases were reported for a rate of 145.8 gonorrhea cases per 100,000 population (Figure 12, Table 1).
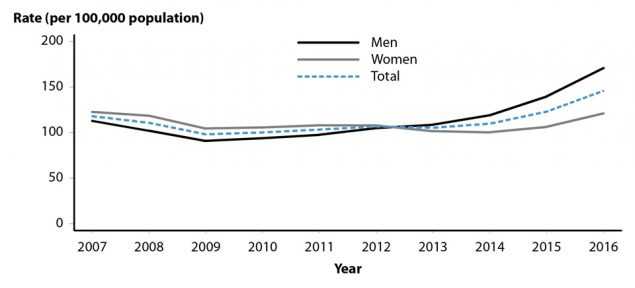
The increase in the gonorrhea rate during 2015–2016 was observed among both males and females; however, the increase was larger among males (Figure 13). During 2015–2016, the gonorrhea rate increased in all regions and, during 2012–2016, the largest increase was observed in the West (95.7%; 72.6 to 142.1 cases per 100,000 population) (Figure 14, Table 14). The rate of gonorrhea continued to increase among persons in every age group during 2015–2016 (Table 21).
N. gonorrhoeae has progressively developed resistance to each of the antimicrobials used for treatment of gonorrhea. Declining susceptibility to cefixime (an oral cephalosporin antibiotic) resulted in a change to the CDC treatment guidelines, so that dual therapy with ceftriaxone (an injectable cephalosporin) and azithromycin is now the only CDC recommended treatment regimen for gonorrhea.3 The emerging threat of cephalosporin resistance highlights the need for continued surveillance of N. gonorrhoeae antimicrobial susceptibility.
The combination of persistently high gonorrhea morbidity in some populations and the threat of cephalosporin-resistant gonorrhea reinforces the need to better understand the epidemiology of gonorrhea.
Interpreting Rates of Reported Cases of Gonorrhea
Although gonorrhea case reporting is useful for monitoring disease trends, the number of gonorrhea cases reported to CDC is affected by many factors in addition to the actual occurrence of the infection within the population. Changes in the burden of gonorrhea may be masked by changes in screening practices (e.g., screening for chlamydia with tests that also detect N. gonorrhoeae infections or increased screening at extra-genital anatomic sites), the use of diagnostic tests with different test performance (e.g., the broader use of nucleic acid amplification tests [NAATs]), and changes in reporting practices. As with other STDs, the reporting of gonorrhea cases to CDC is incomplete.4 For these reasons, supplemental data on gonorrhea prevalence in persons screened in a variety of settings are useful in assessing the burden of disease in selected populations.
Gonorrhea — United States
In 2016, a total of 468,514 cases of gonorrhea were reported in the United States, yielding a rate of 145.8 cases per 100,000 population (Table 1). During 2015–2016, the rate of reported gonorrhea cases increased 18.5%, and increased 48.6% since the historic low in 2009.
Gonorrhea by Region
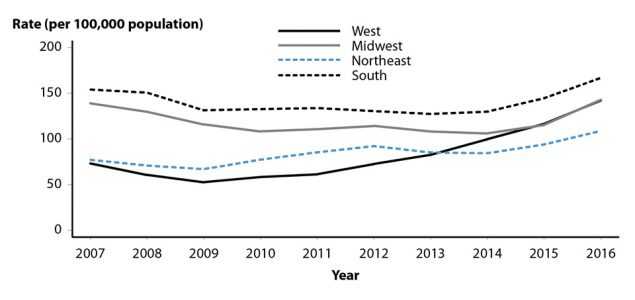
The South had the highest rate of reported gonorrhea cases (166.8 cases per 100,000 population) among the four regions of the United States in 2016, followed by the Midwest (142.9 cases per 100,000 population), the West (142.1 cases per 100,000 population), and the Northeast (108.8 cases per 100,000 population) (Figure 14, Table 14). During 2015–2016, the gonorrhea rate increased in all four regions: 23.8% in the Midwest, 21.9% in the West, 15.7% in the Northeast, and 15.4% in the South (Figure 14, Table 14). During 2012–2016, the rate of gonorrhea in the West increased by 95.7% (72.6 to 142.1 cases per 100,000 population), while other regions had smaller overall increases during this time period (i.e., 27.8% in the South, 25.0% in the Midwest, and 18.0% in the Northeast).
Gonorrhea by State
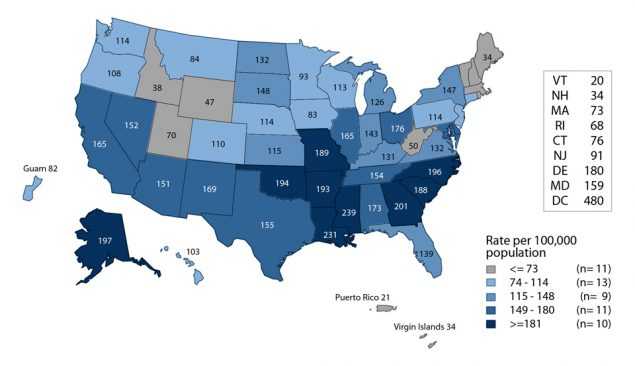
In 2016, rates of reported gonorrhea cases per 100,000 population ranged by state from 20.1 in Vermont to 239.2 in Mississippi; the gonorrhea rate in the District of Columbia was 479.9 cases per 100,000 population (Figure 15, Table 13). During 2015–2016, gonorrhea rates increased in 96.1% of states and the District of Columbia and decreased in 3.9% of states (Table 14).
Gonorrhea by Metropolitan Statistical Area
The overall rate of reported gonorrhea cases in the 50 most populous metropolitan statistical areas (MSAs) was 162.2 cases per 100,000 population in 2016, representing a 19.6% increase compared with the rate in 2015 (135.6 cases per 100,000 population) (Table 17). In 2016, 61.2% of reported gonorrhea cases were reported by these MSAs. Since 2012, the gonorrhea rate among females in the 50 most populous MSAs has been lower than the rate among males (Tables 18 and 19). In 2016, the rate among females in these MSAs was 120.8 cases per 100,000 females, while the rate among males was 204.7 cases per 100,000 males.
Gonorrhea by County
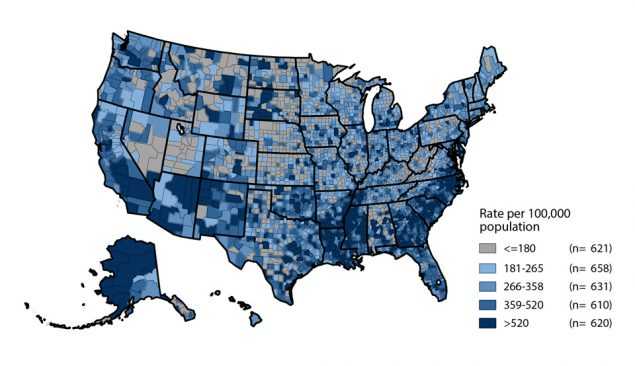
In 2016, 51.0% of reported gonorrhea cases occurred in just 70 counties or independent cities (Table 20). In 2016, 608 counties (19.5%) in the United States had a rate less than or equal to 16 cases per 100,000 population (Figure 16). The rate ranged from 17 to 38 cases per 100,000 population in 631 counties (20.1%), ranged from 39 to 71 cases per 100,000 population in 635 counties (20.2%), ranged from 72 to 139 cases per 100,000 population in 619 counties (19.7%), and was more than 139 cases per 100,000 population in 647 counties (20.6%). As in previous years, counties with the highest gonorrhea rates were concentrated in the South.
Gonorrhea by Sex
As was observed during 2013–2015, the rate of reported gonorrhea cases among males was higher than the rate among females in 2016 (Figure 13, Tables 15 and 16). During 2015–2016, the gonorrhea rate among males increased 22.2% (139.7 to 170.7 cases per 100,000 males), and the rate among females increased 13.8% (106.3 to 121.0 cases per 100,000 females). During 2012–2016, the rate among males increased 62.6% (105.0 to 170.7 cases per 100,000 males) and the rate among females increased 12.1% (107.9 to 121.0 cases per 100,000 females). The magnitude of the increase among males suggests either increased transmission or increased case ascertainment (e.g., through increased extra-genital screening) among gay, bisexual, and other men who have sex with men (collectively referred to as MSM). However, most jurisdictions do not routinely report sex of sex partner or site of infection for gonorrhea cases, so trends in gonorrhea rates among MSM over time cannot be assessed.
Gonorrhea by Region and Sex
In all regions, the rate of gonorrhea increased among both males and females during 2015–2016 and the rate of increase among males was larger than the rate of increase among females (Tables 15 and 16). The rate of reported gonorrhea cases increased the most in the Midwest (26.7% among males and 21.0% among females) and in the West (24.1% among males and 17.2% among females) (Tables 15 and 16).
Gonorrhea by Age
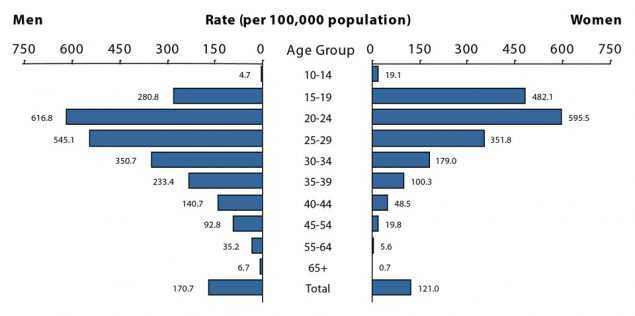
In 2016, rates of reported gonorrhea cases continued to be highest among adolescents and young adults (Figure 17, Table 21). In 2016, the highest rates among females were observed among those aged 20–24 years (595.5 cases per 100,000 females) and 15–19 years (482.1 cases per 100,000 females). Among males, the rate was highest among those aged 20–24 years (616.8 cases per 100,000 males) and 25–29 years (545.1 cases per 100,000 males).
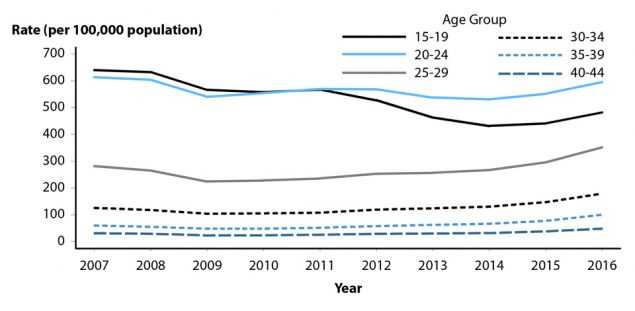
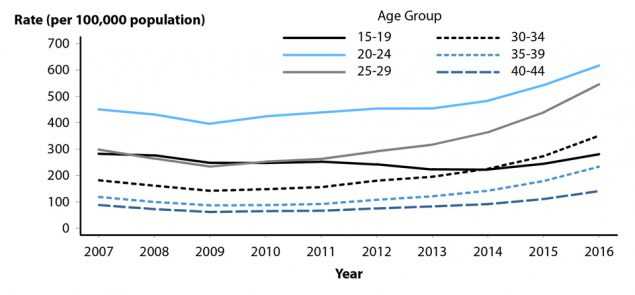
In 2016, persons aged 15–44 years accounted for 91.9% of reported gonorrhea cases with known age. Among 15–19 year olds, rates decreased by 10.7% during 2012–2015 and increased 11.3% during 2015–2016. During 2015–2016, the gonorrhea rate also increased among other age groups: 10.9% among those aged 20–24 years, 22.2% among those aged 25–29 years, 26.2% among those aged 30–34 years, 30.3% among those aged 35–39 years, and 27.0% among those aged 40–44 years (Figures 18 and 19, Table 21). Among persons aged 15–44 years, increases were observed in all age groups for both men and women during 2015–2016.
Gonorrhea by Race/Ethnicity
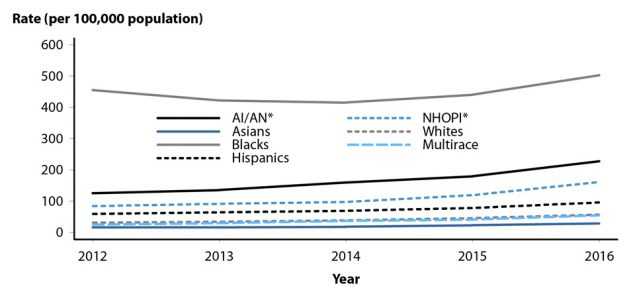
In 2016, among the 50 states and the District of Columbia that submitted data in the race and ethnicity categories according to Office of Management and Budget (OMB) standards (see Section A1.5 in the Appendix), the rate of reported gonorrhea cases remained highest among Blacks (481.2 cases per 100,000 population) (Table 22B). The rate among Blacks was 8.6 times the rate among Whites (55.7 cases per 100,000 population). The gonorrhea rate among American Indians/Alaska Natives (242.9 cases per 100,000 population) was 4.4 times that of Whites, the rate among Native Hawaiians/Other Pacific Islanders (165.8 cases per 100,000 population) was 3.0 times that of Whites, the rate among Hispanics (95.9 cases per 100,000 population) was 1.7 times that of Whites, the rate among Multirace persons (62.3 cases per 100,000 population) was 1.1 times that of Whites, and the rate among Asians (28.3 cases per 100,000 population) was half the rate of Whites (Table 22B).
During 2012–2016, among the 46 states that submitted race and ethnicity data according to OMB standards (see Section A1.5 in the Appendix) for all five years during that period, the gonorrhea rate increased among all race and ethnicity groups: 120.4% among Multirace persons, 91.4% among Native Hawaiians/Other Pacific Islanders, 82.5% among Whites, 81.3% among American Indians/Alaska Natives, 76.7% among Asians, 61.8% among Hispanics, and 10.5% among Blacks (Figure 20).
More information on gonorrhea rates among race/ethnicity groups can be found in the Special Focus Profiles.
Gonorrhea by Reporting Source
In 2016, 10.5% of gonorrhea cases were reported from STD clinics, 75.4% were reported from venues outside of STD clinics, and 14.0% had an unknown source of report (Table A2).
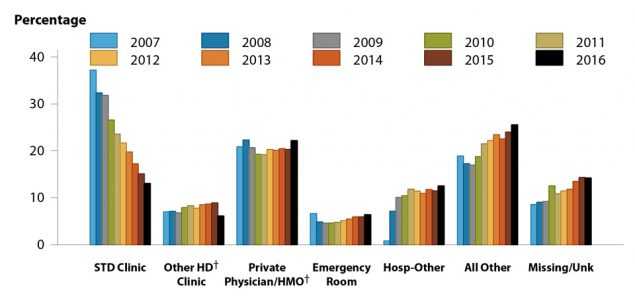
During 2007–2016, the percent of gonorrhea cases reported by STD clinics declined 64.8% among males and 59.3% among females; however, the percent of gonorrhea cases with missing/unknown reporting source increased 65.2% among males and 45.7% among females (Figures 21 and 22). During 2015–2016, the percent of gonorrhea cases reported by STD clinics decreased 13.5% among males and 9.6% among females.
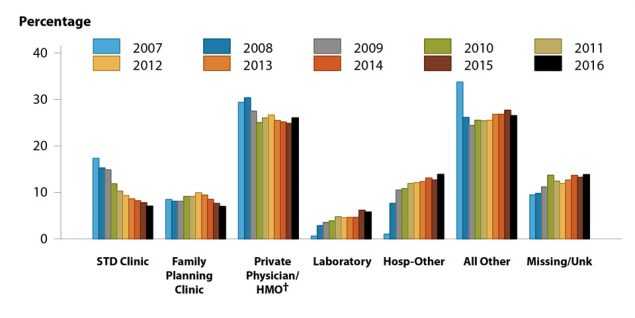
In 2016, among males, private physicians/health maintenance organizations (HMOs) (22.2%) were the most common reporting source, followed by STD clinics (13.1%), other hospital clinics/facilities (12.5%), emergency rooms (6.4%), and other health department clinics (6.1%) (Figure 21). Among females, private physicians/HMOs (26.0%) were the most common reporting source, followed by other hospital clinics/facilities (13.9%), STD clinics (7.0%), family planning clinics (7.0%), and laboratories (5.8%) (Figure 22).
STD Surveillance Network
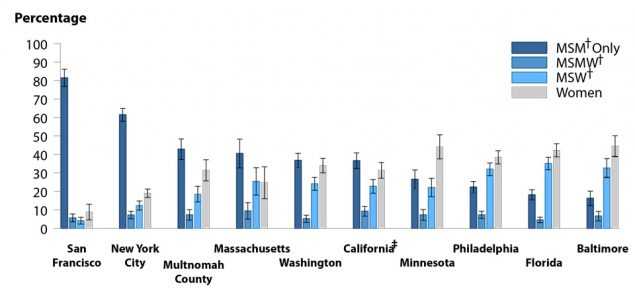
The STD Surveillance Network (SSuN) is an ongoing collaboration of states and independently funded cities collecting enhanced information on a representative sample of gonorrhea case reports received from all reporting sources in their jurisdiction. Enhanced gonorrhea case report data for 2016 were obtained from Cycle 3 of SSuN, which includes 10 jurisdictions randomly sampling cases reported in their jurisdictions. In 2016, SSuN collaborators interviewed 5,177 gonorrhea cases representing 3.6% of all cases reported from participating jurisdictions. The estimated burden of disease represented by men who have sex with men only (MSM-only), men who have sex with both men and women (MSMW), men who have sex with women only (MSW), and women varied substantially across collaborating sites based on weighted analysis (Figure 23). San Francisco had the highest proportion of cases estimated to be MSM-only (81.4%), while Baltimore had the lowest proportion of MSM-only cases at 16.2%. Across all jurisdictions, an estimated 6.7% of gonorrhea cases were attributable to MSMW, which is an important group representing a bridge between MSM-only and heterosexual populations. (Figure 23). In total, across all SSuN sites, 44.7% of gonorrhea cases were estimated to be among MSM-only or MSMW, 22.6% among MSW, and 32.7% among women.
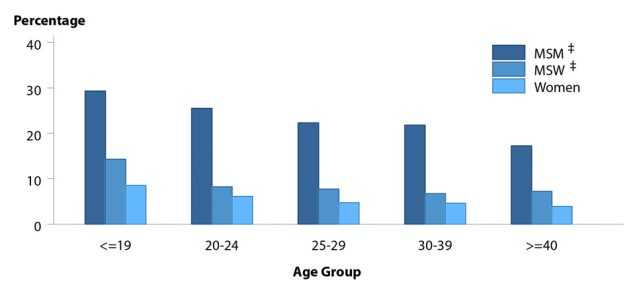
Collaborating SSuN jurisdictions also conduct sentinel surveillance on all patients seeking care in selected STD clinics. Sentinel facility data for this report includes information from patients attending STD clinics during 2016 in nine out of the 10 funded jurisdictions. In 2016, the proportion of STD clinic patients who tested positive for gonorrhea varied by age group, sex, and sex of sex partner (Figure 24). Among those attending these clinics, MSM disproportionately had higher positivity rates when compared to MSW and women in all age groups. While positivity rates declined with increasing age for heterosexual males and females, a much slower decline by age was seen in MSM-only.
Additional information about SSuN methodology can be found in Section A2.2 of the Appendix.
Gonococcal Isolate Surveillance Project
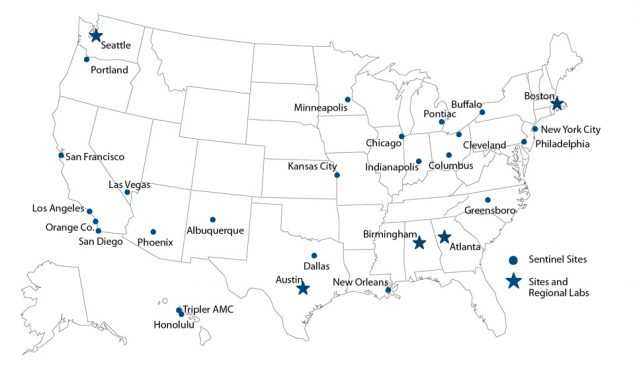
Antimicrobial resistance remains an important consideration in the treatment of gonorrhea.3,5–7 In 1986, the Gonococcal Isolate Surveillance Project (GISP), a national sentinel surveillance system, was established to monitor trends in antimicrobial susceptibilities of urethral N. gonorrhoeae strains in the United States.7 Data are collected from selected STD clinic sentinel sites and from regional laboratories (Figure 25).
Antimicrobial susceptibility is measured by the minimum inhibitory concentration (MIC), the lowest antimicrobial concentration that inhibits bacterial growth in the laboratory. Increases in MICs demonstrate that the bacteria can survive at higher antimicrobial concentrations in the laboratory. Monitoring of MIC trends is useful because increasing MICs can oftentimes be an early indicator of the emergence of antimicrobial resistance.
Information on the antimicrobial susceptibility criteria used in GISP can be found in Section A2.3 in the Appendix. More information about GISP and additional data can be found at https://www.cdc.gov/std/GISP.
Ceftriaxone Susceptibility
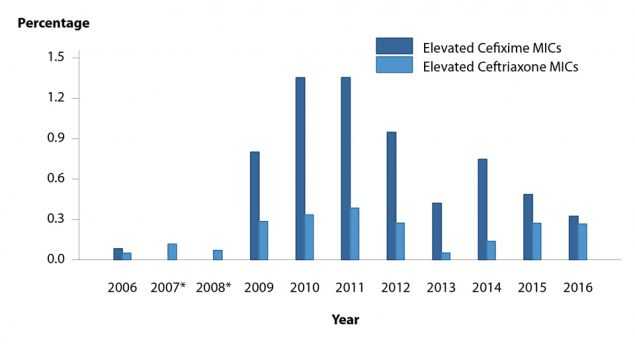
Susceptibility testing for ceftriaxone began in 1987. During 2006–2016, the percentage of GISP isolates that exhibited elevated ceftriaxone MICs, defined as ≥0.125 μg/ml, fluctuated between 0.05% and 0.4% (Figure 26).
In 2016, 0.3% of isolates had elevated ceftriaxone MICs. Five isolates with decreased ceftriaxone susceptibility (MIC = 0.5 μg/ml) have been previously identified in GISP: one from San Diego, California (1987), two from Cincinnati, Ohio (1992 and 1993), one from Philadelphia, Pennsylvania (1997), and one from Oklahoma City, Oklahoma (2012).
Cefixime Susceptibility
Susceptibility testing for cefixime began in 1992, was discontinued in 2007, and was restarted in 2009. The percentage of isolates with elevated cefixime MICs (≥0.25μg/ ml) declined from 1.4% in 2011 to 0.3% in 2016 (Figure 26).
Azithromycin Susceptibility
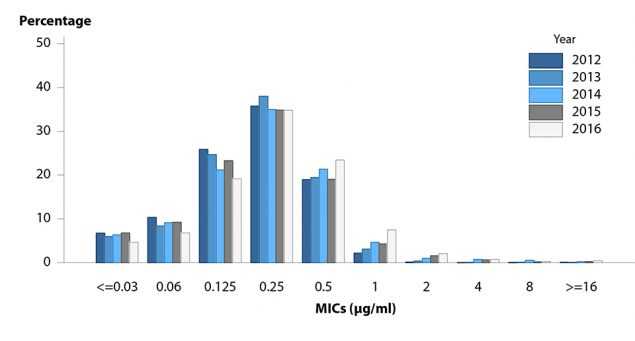
Susceptibility testing for azithromycin began in 1992. Figure 27 displays the distribution of azithromycin MICs among GISP isolates collected during 2012–2016. Most isolates had MICs of 0.125–0.5 μg/ml. During 2012–2014, the percentage of isolates with elevated azithromycin MICs (MICs ≥ 2 μg/ml) ranged from 0.02% to 1.0%; during 2014–2016, the percentage increased from 2.4% to 3.6%.
Susceptibility to Other Antimicrobials
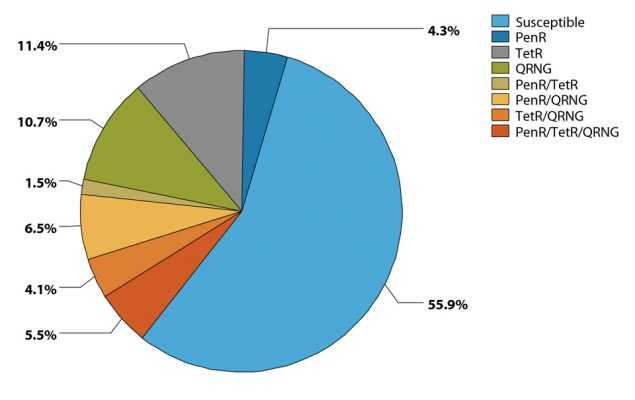
In 2016, 44.1% of isolates collected from GISP sites were resistant to penicillin, tetracycline, ciprofloxacin, or some combination of those antimicrobials (Figure 28). Although these antimicrobials are no longer recommended for treatment of gonorrhea, the resistance phenotypes remain common. Conversely, 55.9% of isolates were susceptible to all three of these antimicrobials.
Antimicrobial Treatments Given for Gonorrhea
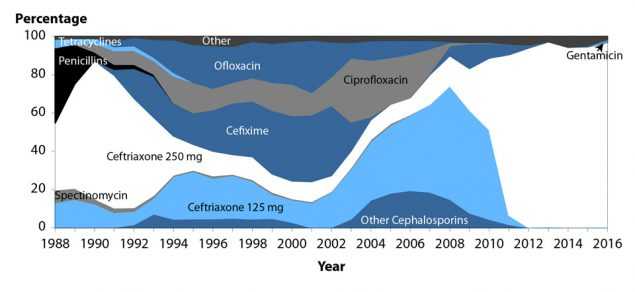
The antimicrobial agents given to GISP patients for gonorrhea therapy are shown in Figure 29. The proportion of patients treated with ceftriaxone 250 mg increased from 84.0% in 2011 to 96.9% in 2016. In 2016, 1.5% of patients were treated with gentamicin 240 mg and 0.1% were treated with cefixime 400mg.
Gonorrhea Among Special Populations
More information about gonorrhea in race/ethnicity groups, females of reproductive age, adolescents, and MSM can be found in the Special Focus Profiles.
Gonorrhea Summary
The national rate of reported gonorrhea cases reached a historic low in 2009, but increased each year during 2009–2012. After a temporary decrease in 2013, the gonorrhea rate increased again during 2014–2016.
This increase was largely attributable to increases among men. High gonorrhea rates persist in certain geographic areas, among adolescents and young adults, and in some racial/ethnic groups.
GISP continues to monitor for the emergence of decreased susceptibility and resistance to cephalosporins and azithromycin.
References
1. Fleming DT, Wasserheit JN. From epidemiological synergy to public health policy and practice: the contribution of other sexually transmitted diseases to sexual transmission of HIV infection. Sex Transm Infect 1999; 75(1): 3–17.
2. Hogben M, Leichliter JS. Social determinants and sexually transmitted disease disparities. Sex Transm Dis 2008; 35(12 Suppl): S13–18.
3. Centers for Disease Control and Prevention. Sexually transmitted diseases treatment guidelines, 2015. MMWR Recomm Rep 2015; 64(No. RR-3): 1–137.
4. Satterwhite CL, Torrone E, Meites E, et al. Sexually transmitted infections among US women and men: prevalence and incidence estimates, 2008. Sex Transm Dis 2013; 40(3): 187–193. DOI: 10.1097/
OLQ.0b013e318286bb53. Review.
5. Centers for Disease Control and Prevention. Update to CDC’s sexually transmitted diseases treatment guidelines, 2006: fluoroquinolones no longer recommended for treatment of gonococcal infections. MMWR Morb Mortal Wkly Rep 2007; 56(14): 332–336.
6. Centers for Disease Control and Prevention. Sexually transmitted diseases treatment guidelines, 2010. MMWR Recomm Rep 2010; 59(No.RR-12): 1–110.
7. Schwarcz S, Zenilman J, Schnell D, et al. National surveillance of antimicrobial resistance in Neisseria gonorrhoeae. JAMA 1990; 264(11): 1413–1417.
- Page last reviewed: September 26, 2017
- Page last updated: September 26, 2017
- Content source: