

Figure 12. Gonorrhea — Rates of Reported Cases by Year, United States, 1941–2016
 ShareCompartir
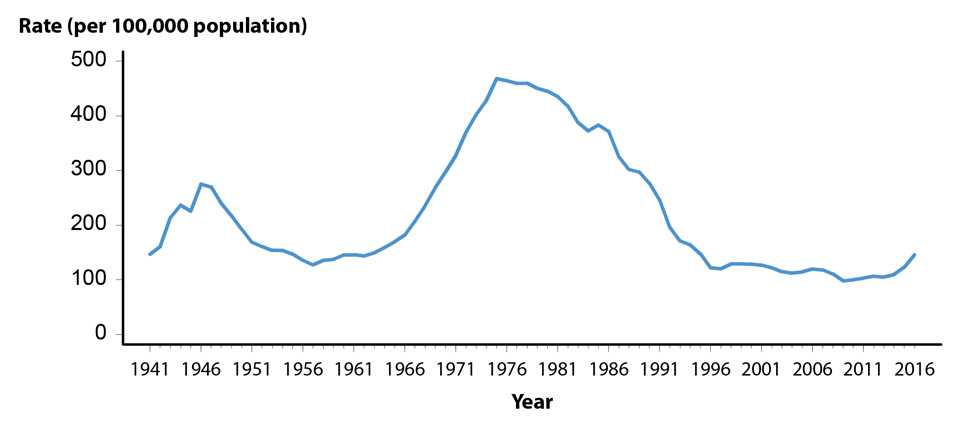
NOTE: Data collection for gonorrhea began in 1941; however, gonorrhea became nationally notifiable in 1944. Refer to the National Notifiable Disease Surveillance System (NNDSS) website for more information: https://wwwn.cdc.gov/nndss/conditions/gonorrhea/.
Data provided in table 1.
- Page last reviewed: September 26, 2017
- Page last updated: September 26, 2017
- Content source: