

Customizable Infographic with Instructions
 ShareCompartir
On this page, you will find a customizable infographic that allows you to add state or local-level STD data to post on your website and share in your community. There is a detailed set of instructions to help customize this material. Ready-made state-specific graphics are also available.
What to Do and How to Do It
- Chrome settings can interfere with this process. If you have issues, try downloading the PDF with Internet Explorer instead.
- Right-click this link to download and save the PDF to your device.
- Open the PDF from your desktop, not your browser. Keep these instructions visible in another window if possible.
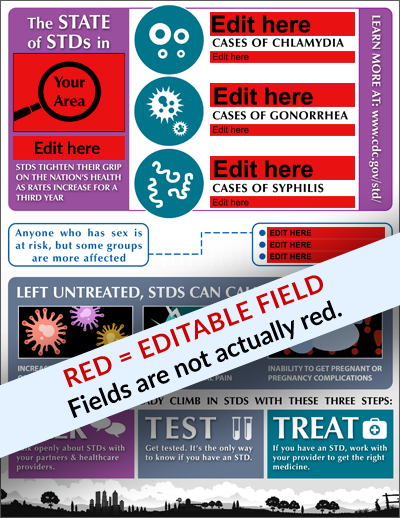
- Note that there are 11 editable areas: one image and ten text fields. They are not red like the image on this page.
- If you want to replace the image labeled “Your Area,” click the magnifying glass. You will be prompted to browse for a .pdf file to replace “Your Area.” If you can browse for other file types (e.g. .jpg or .png), those will also work. Select an image to replace “Your Area.” If you do not have a logo image, ready-made graphics of states can be downloaded at the bottom of this page.
- Editable text fields all read “Edit here.” Click to edit them. To see the type of information intended for these fields, see the National Version. Data pertaining to your state can be found in the State Ranking Tables [PDF – 82 KB].
- Save your customized infographic with a new name.
- Print or share.

- Page last reviewed: September 26, 2017
- Page last updated: September 26, 2017
- Content source: