

Chlamydia
 ShareCompartir
Background
Chlamydia trachomatis, is the most common notifiable disease in the United States. It is among the most prevalent of all STDs, and since 1994, has comprised the largest proportion of all STDs reported to CDC (Table 1). Studies also demonstrate the high prevalence of chlamydial infections in the general U.S. population, particularly among young women.1
Chlamydial infections in women are usually asymptomatic.2 Untreated infection can result in pelvic inflammatory disease (PID), which is a major cause of infertility, ectopic pregnancy, and chronic pelvic pain. Data from randomized controlled trials of chlamydia screening suggested that screening programs can lead to a reduction in the incidence of PID.3,4 As with other inflammatory STDs, chlamydial infection could facilitate the transmission of HIV infection.5 In addition, pregnant women infected with chlamydia can pass the infection to their infants during delivery, potentially resulting in ophthalmia neonatorum, which can lead to blindness, and pneumonia. Because of the large burden of disease and risks associated with infection, CDC recommends annual chlamydia screening for all sexually active women younger than age 25 years and women ≥25 years at increased risk for infection (e.g., women with new or multiple sex partners).6
The Healthcare Effectiveness Data and Information Set (HEDIS) contains a measure which assesses chlamydia screening coverage of sexually active young women who receive medical care through commercial or Medicaid managed care organizations. Among sexually active women aged 16–24 years in commercial health maintenance screening increased from 23.1% in 2001 to 47.4% in 2015. Among sexually-active women aged 16–24 years covered by Medicaid, screening rates increased from 40.4% in 2001 to 58.0% in 2011, then decreased to 55.2% in 2015.7 Although chlamydia screening has expanded over the past two decades, many women who are at risk are still not being tested—reflecting, in part, the lack of awareness among some health care providers and the limited resources available to support these screenings.
Interpreting Rates of Reported Cases of Chlamydia
Trends in rates of reported cases of chlamydia are influenced by changes in incidence of infection, as well as changes in diagnostic, screening, and reporting practices. As chlamydial infections are usually asymptomatic, the number of infections identified and reported can increase as more people are screened even when incidence is flat or decreasing. During 2000–2011, the expanded use of more sensitive diagnostic tests (e.g., nucleic acid amplification tests [NAATs]) likely increased the number of infections identified and reported independently of increases in incidence. Also, although chlamydia has been a nationally notifiable condition since 1995, it was not until 2000 that all 50 states and the District of Columbia required reporting of chlamydia cases. National case rates prior to 2000 reflect incomplete reporting. The increased use of electronic laboratory reporting over the last decade or so also likely increased the proportion of diagnosed cases reported. Consequently, an increasing chlamydia case rate over time may reflect increases in incidence of infection, screening coverage, and use of more sensitive tests, as well as more complete reporting. Likewise, decreases in chlamydia case rates may suggest decreases in incidence of infection or screening coverage.
Chlamydia — United States
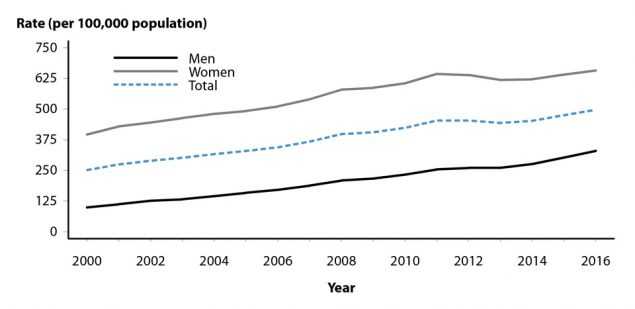
In 2016, a total of 1,598,354 chlamydial infections were reported to CDC in 50 states and the District of Columbia (Table 1). This case count corresponds to a rate of 497.3 cases per 100,000 population. During 2000–2011, the rate of reported chlamydial infection increased from 251.4 to 453.4 cases per 100,000 population (Figure 1, Table 1). During 2011–2013, the rate of reported cases decreased to 443.5 cases per 100,000 population, followed by an increase in the rate of reported cases over each of the next 3 years. During 2015–2016, the rate increased 4.7%, from 475.0 to 497.3 cases per 100,000 population (Figure 1, Table 1).
Chlamydia by Region
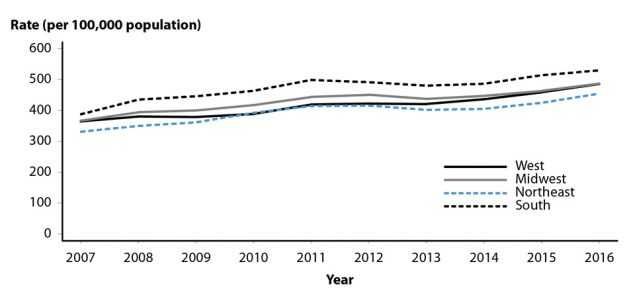
In 2016, rates of reported cases of chlamydia were highest in the South (529.7 cases per 100,000 population, 3.0% increase from 2015), followed by the Midwest (487.5, 5.1% increase from 2015), West (485.9, 5.8% increase from 2015), and Northeast (454.6, 7.0% increase from 2015) (Table 3). During 2007–2012, rates of reported cases of chlamydia increased in all regions (Figure 2). During 2012–2013, rates decreased in the Northeast, Midwest, and South and remained stable in the West. During 2013–2016, rates increased in all regions, with the largest increase occurring in the West (421.1 to 485.9 cases per 100,000 population, 15.4% increase) (Table 3).
Chlamydia by State
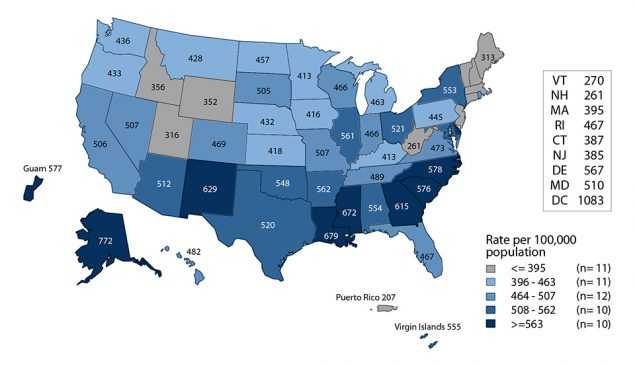
In 2016, rates of reported cases of chlamydia by state ranged from 260.6 cases per 100,000 population in New Hampshire to 771.6 cases per 100,000 population in Alaska (Figure 3, Table 2); the rate in the District of Columbia was 1,083.4 cases per 100,000 population (Table 3). During 2015–2016, rates of reported chlamydia cases increased in 44 states and the District of Columbia. The rate of reported chlamydia cases in 2016 was above the U.S. total in 21 states.
Chlamydia by Metropolitan Statistical Area
The rate of reported cases of chlamydia in the 50 most populous metropolitan statistical areas (MSAs) increased 6.2% during 2015–2016 (489.6 to 520.1 cases per 100,000 population, respectively) (Table 6). In 2016, 57.5% of chlamydia cases were reported by these MSAs. During 2015–2016, the rate of reported cases of chlamydia in these MSAs increased 3.9% among women (639.8 to 664.5 cases per 100,000 females) and 10.9% among men (331.8 to 368.0 cases per 100,000 males) (Tables 7 and 8).
Chlamydia by County
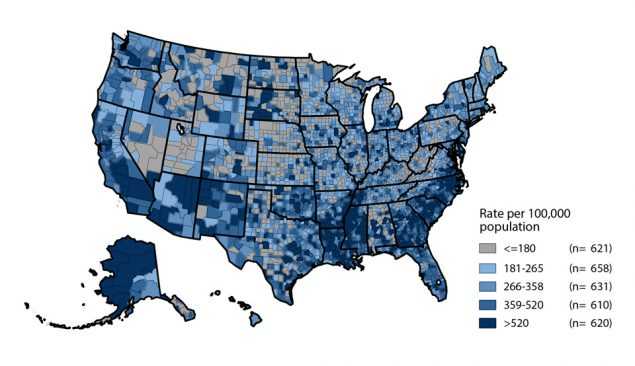
In 2016, 620 (19.7%) of 3,140 counties had rates of reported chlamydia higher than 520 cases per 100,000 population (Figure 4). Seventy counties and independent cities reported 43.4% of all chlamydia cases in 2016 (Table 9). Of the 70 counties and independent cities reporting the highest number of chlamydia cases, 47 (67.1%) were located in the South and West (Table 9).
Chlamydia by Sex
In 2016, 1,072,719 cases of chlamydia were reported among females for a rate of 657.3 cases per 100,000 females (Table 4). After increasing each year during 2000–2011, the rate of reported chlamydia cases among females decreased during 2011–2013, followed by an increase in the rate of reported cases over each of the next three years (Figure 1). The rate among females increased 0.4% during 2013–2014, 3.0% during 2014–2015, and 2.6% during 2015–2016, for a total increase of 6.2% during 2013–2016.
There were 522,870 cases of chlamydia reported among males in 2016 for a rate of 330.5 cases per 100,000 males (Table 5). The rate of reported cases among males increased each year during 2000–2016, with the exception of 2012–2013, where rates remained stable (Figure 1). During 2015–2016 alone, the rate among men increased 9.2%; however, during 2012–2016, rates of reported cases among men increased 26.8% (compared with a 2.9% increase among women) (Tables 4 and 5). This pronounced increase among men could be attributed to either increased transmission or improved case identification (e.g., through intensified extra-genital screening efforts) among gay, bisexual, and other men who have sex with men (collectively referred to as MSM). This cannot be assessed, however, as most jurisdictions do not routinely report sex of sex partner or anatomic site of infection.
Despite this considerable increase in men, the rate of reported chlamydia cases among females was still about two times the rate among males in 2016, likely reflecting a larger number of women screened for this infection (Figure 1, Tables 4 and 5). The lower rate among men also suggests that many of the sex partners of women with chlamydia are not receiving a diagnosis of chlamydia or being reported as having chlamydia.
Chlamydia by Age
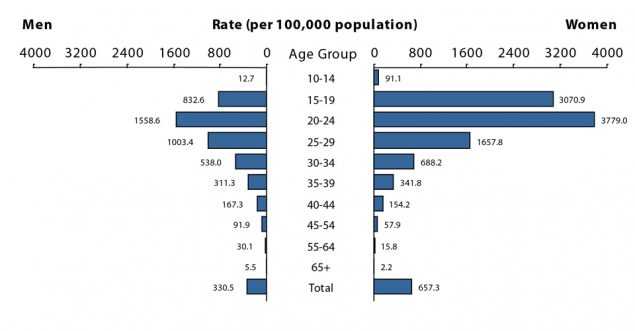
The rates of reported cases of chlamydia are highest among adolescents and young adults aged 15–24 years (Table 10). In 2016, the age-specific rate of reported cases of chlamydia among 15–19 year olds was 1,929.2 cases per 100,000 population and the rate among 20–24 year olds was 2,643.8 cases per 100,000 population (Table 10).
Among females, the highest age specific rates of reported cases of chlamydia in 2016 were among those aged 15–19 years (3,070.9 cases per 100,000 females) and 20–24 years (3,779.0 cases per 100,000 females) (Figure 5, Table 10). Within these age groups, rates were highest among women aged 19 years (4,970.1 cases per 100,000 females) and 20 years (4,734.8 cases per 100,000 females) (Table 12). The rate of reported cases among women aged 15–19 and 20–24 years increased over the last two and three years, respectively. The rate among 15–19 year olds increased 2.8% during 2015–2016, with a total increase of 4.1% during 2014–2016 (2,949.3 to 3,070.9 per 100,000 females). The rate among 20–24 year olds increased 0.4% during 2015–2016, with a total increase of 5.1% during 2013–2016 (3594.2 to 3779.0 per 100,000 females) (Table 10).
In 2016, the age-specific rates of reported cases of chlamydia among men, although substantially lower than rates among women, were highest in those aged 20–24 years (1,558.6 cases per 100,000 males) (Figure 5, Table 10). Similar to trends in women, the rate of reported cases among men aged 15–19 and 20–24 years increased over the last two and three years, respectively. The rate among 15–19 year olds increased 8.6% during 2015–2016, with a total increase of 15.3% during 2014–2016 (722.4 to 832.6 per 100,000 males). The rate among 20–24 year olds increased 5.5% during 2015–2016, with a total increase of 18.9% during 2013–2016 (1,310.9 to 1,558.6 per 100,000 females) (Table 10).
Chlamydia by Race/Ethnicity
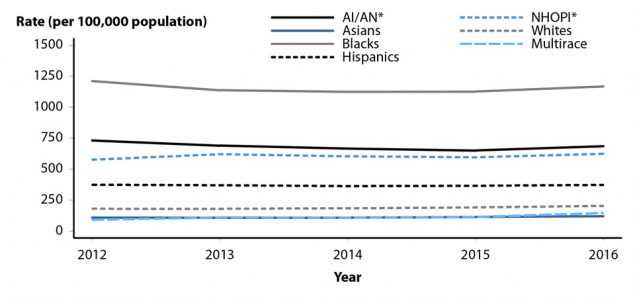
Among the 50 states and the District of Columbia that submitted race and ethnicity data in 2016 according to Office of Management and Budget (OMB) standards (see Section A1.5 in the Appendix), rates of reported cases of chlamydia were highest among Black, American Indian/Alaska Native, and Native Hawaiian/Other Pacific Islander women (Figure R, Table 11B). Overall, the rate of reported cases of chlamydia among Blacks was 5.6 times the rate among Whites (1,125.9 and 199.8 cases per 100,000 population, respectively). The rate among American Indians/Alaska Natives (749.8 cases per 100,000 population) was 3.8 times the rate among Whites. The rate among Native Hawaiians/Other Pacific Islanders (653.4 cases per 100,000 population) was 3.3 times the rate among Whites. The rate among Hispanics (374.6 cases per 100,000 population) was 1.9 times the rate among Whites. The rate among Asians was lower than the rate among Whites (119.3 cases per 100,000 population).
During 2012–2016, 46 states submitted race and ethnicity data according to the OMB standards (see Section A1.5 in the Appendix). During 2012–2016, rates of reported chlamydia cases increased among Whites (12.7%), Asians (10.2%), Native Hawaiians/Other Pacific Islanders (8.3%), and Multirace (60.6%), and decreased in American Indians/Alaska Natives (6.4%) and Blacks (3.5%) (Figure 6). Rates were stable among Hispanics during 2012–2016. During 2015–2016, rates increased among all racial/ethnic groups (Whites: 6.3%, Asians: 5.7%, American Indians/Alaska Natives: 5.3%, Native Hawaiians/Other Pacific Islanders: 4.7%, Blacks: 3.7%, Hispanics 1.9%, and Multirace: 27.6%) (Figure 6).
More information on chlamydia rates among race/ethnicity groups can be
found in the Special Focus Profiles.
Chlamydia by Reporting Source
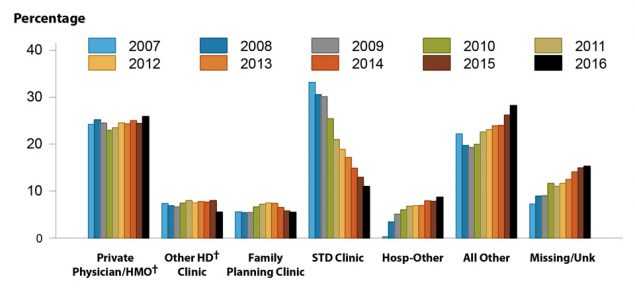
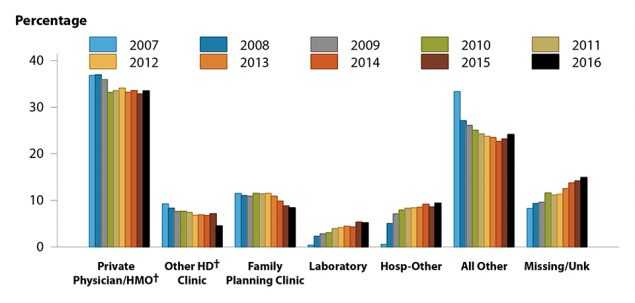
In 2016, 6.4% of chlamydia cases were reported from STD clinics, 78.4% were reported from venues outside of STD clinics, and 15.2% had an unknown source of report (Table A2). Over time, the proportion of male cases reported from STD clinic sites has decreased substantially, from 33.1% in 2007 to 11.0% in 2016 (Figure 7). In 2016, among women, only 4.2% of chlamydia cases were reported through an STD clinic (Table A2). A large proportion of cases among women (33.5%) were reported from private physicians/HMOs in 2016 (Figure 8). Among men, 25.9% of cases were reported from private physicians/HMOs (Figure 7).
Chlamydia Prevalence in the Population
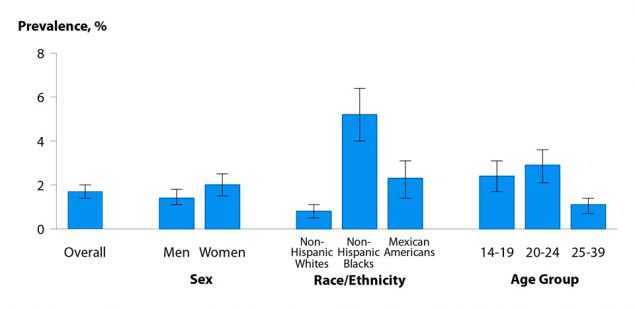
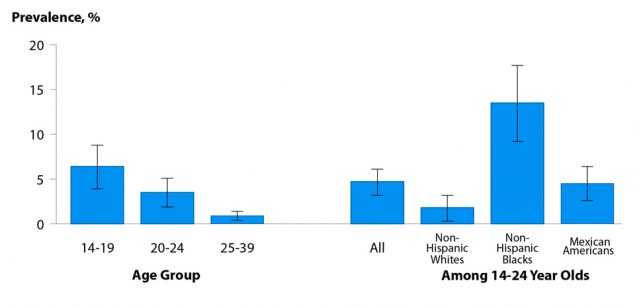
The National Health and Nutrition Examination Survey (NHANES; see Section A2.4 in the Appendix) is a nationally representative survey of the U.S. civilian, non-institutionalized population that provides an important measure of chlamydia disease burden in respondents aged 14–39 years. During 2007–2012, the overall prevalence of chlamydia among persons aged 14–39 years was 1.7% (95% Confidence Interval [CI]: 1.4–2.0) (Figure 9). Among sexually active females aged 14–24 years, the population targeted for screening, prevalence was 4.7% (95% CI: 3.2–6.1), with the highest prevalence among non-Hispanic Black females (13.5%, 95% CI: 9.2–17.7) (Figure 10).1
Chlamydia Positivity in Selected Populations
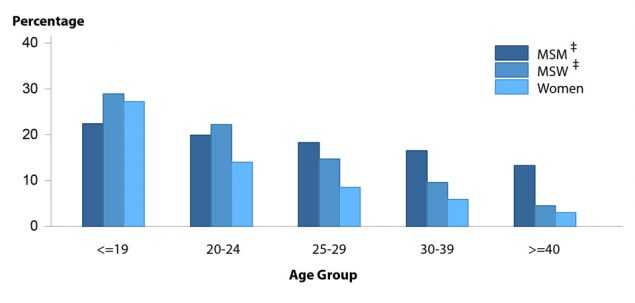
The STD Surveillance Network (SSuN) is an ongoing collaboration of 10 state, county, and city health departments collecting enhanced clinical and behavioral information among patients attending 30 STD clinics in the SSuN jurisdictions (See Section A2.2 of the Appendix).
In 2016, the proportion of STD clinic patients testing positive for chlamydia varied by age, sex, and sexual behavior. Adolescent men who have sex with women only (MSW) had the highest prevalence (28.9%), either reflecting disproportionate testing of men with urethritis or targeted testing of partners of women diagnosed with chlamydia. Prevalence among all those tested decreased with age, though the variation in prevalence by age was not as pronounced for MSM (Figure 11).
Chlamydia Among Special Populations
More information on chlamydia among women of reproductive age, adolescents and young adults, MSM, and minority populations is presented in the Special Focus Profiles.
Chlamydia Summary
Chlamydia continues to be the most commonly reported nationally notifiable disease, with 1,598,354 cases reported in 2016 and increasing rates of reported cases over each of the last three years. Rates of reported chlamydia cases increased 4.7% during 2015–2016. The Southern region of the U.S. reported the highest rate of chlamydial infection in 2016; the Northeast reported the largest rate increase during 2015–2016, at 7.0%. In 2016, the rate of reported cases of chlamydia in women was two times the rate in men. However, during 2012–2016, the rate in men increased 26.8%, whereas the rate in women increased only 2.9%. Potential reasons for this considerable increase in male cases could be due to a true increase in cases or to improved screening coverage in men, especially increased extra-genital screening in MSM.
The facilities reporting chlamydial infections have changed over the last 10 years or so, with most (78.4%) chlamydia cases in 2016 reported from venues outside of STD clinics. The proportion of men being diagnosed with chlamydia in STD clinics decreased 66.8% from 33.1% in 2007 to 11.0% in 2016; in 2016 alone, approximately one-third of chlamydia cases among women were reported from private physicians/HMOs. Racial differences also persist; reported case rates and prevalence estimates among Blacks continue to be substantially higher than among all other racial/ethnic groups. Rates of reported cases of chlamydia were next highest among American Indian/Alaska Native and Native Hawaiian/Other Pacific Islander women. Ultimately, both test positivity and the number of reported cases of C. trachomatis infections remain high among most age groups, racial/ethnic groups, geographic areas, and both sexes.
References
1. Torrone E, Papp J, Weinstock H. Prevalence of Chlamydia trachomatis genital infection among persons aged 14–39 years — United States, 2007–2012. MMWR 2014; 63(38): 834–838.
2. Stamm WE. Chlamydia trachomatis infections in the adult. In: Holmes, KK, Sparling, PF, Stamm, WE, Piot, P, Wasserheit, JN, Corey, L, Cohen, MS, Watts, DH. Sexually Transmitted Diseases. 4th ed. New York, NY: McGraw-Hill; 2008: 575–606.
3. Scholes D, Stergachis A, Heidrich FE, et al. Prevention of pelvic inflammatory disease by screening for cervical chlamydial infection. N Engl J Med 1996; 334(21): 1362–1366.
4. Oakeshott P, Kerry S, Aghaizu A, et al. Randomised controlled trial of screening for Chlamydia trachomatis to prevent pelvic inflammatory disease: the POPI (prevention of pelvic infection) trial. BMJ 2010; 340: c1642.
5. Fleming DT, Wasserheit JN. From epidemiological synergy to public health policy and practice: the contribution of other sexually transmitted diseases to sexual transmission of HIV infection. Sex Transm Infect 1999; 75(1): 3–17.
6. Centers for Disease Control and Prevention. Sexually transmitted diseases treatment guidelines, 2015. MMWR Recomm Rep 2015; 64(RR-3): 1–137. Erratum in: MMWR 2015; 64(33): 924.
7. National Committee for Quality Assurance. The State of Healthcare Quality 2016. Available at: http://www.ncqa.org/report-cards/health-plans/state-of-health-care-quality. Accessed July 27, 2017.
- Page last reviewed: September 26, 2017
- Page last updated: September 26, 2017
- Content source: