

Figure 9. Chlamydia — Prevalence Among Persons Aged 14–39 Years by Sex, Race/Ethnicity, or Age Group, National Health and Nutrition Examination Survey (NHANES), 2007–2012
 ShareCompartir
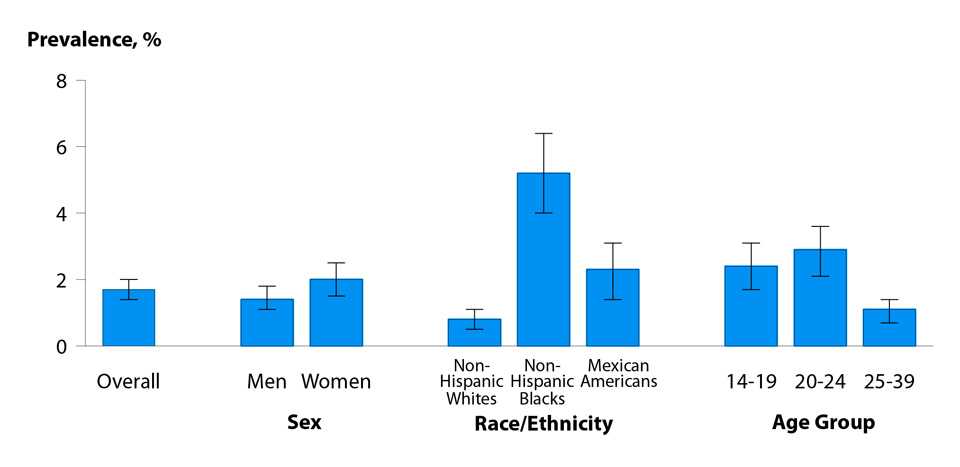
NOTE: Error bars indicate 95% confidence intervals.
SOURCE: Torrone E, Papp J, Weinstock H. Prevalence of Chlamydia trachomatis genital infection among persons aged 14–39 years — United States, 2007–2012. MMWR Morb Mortal Wkly Rep 2014; 63(38):834–838.
- Page last reviewed: September 26, 2017
- Page last updated: September 26, 2017
- Content source: