

2016 Sexually Transmitted Diseases Surveillance
 ShareCompartir

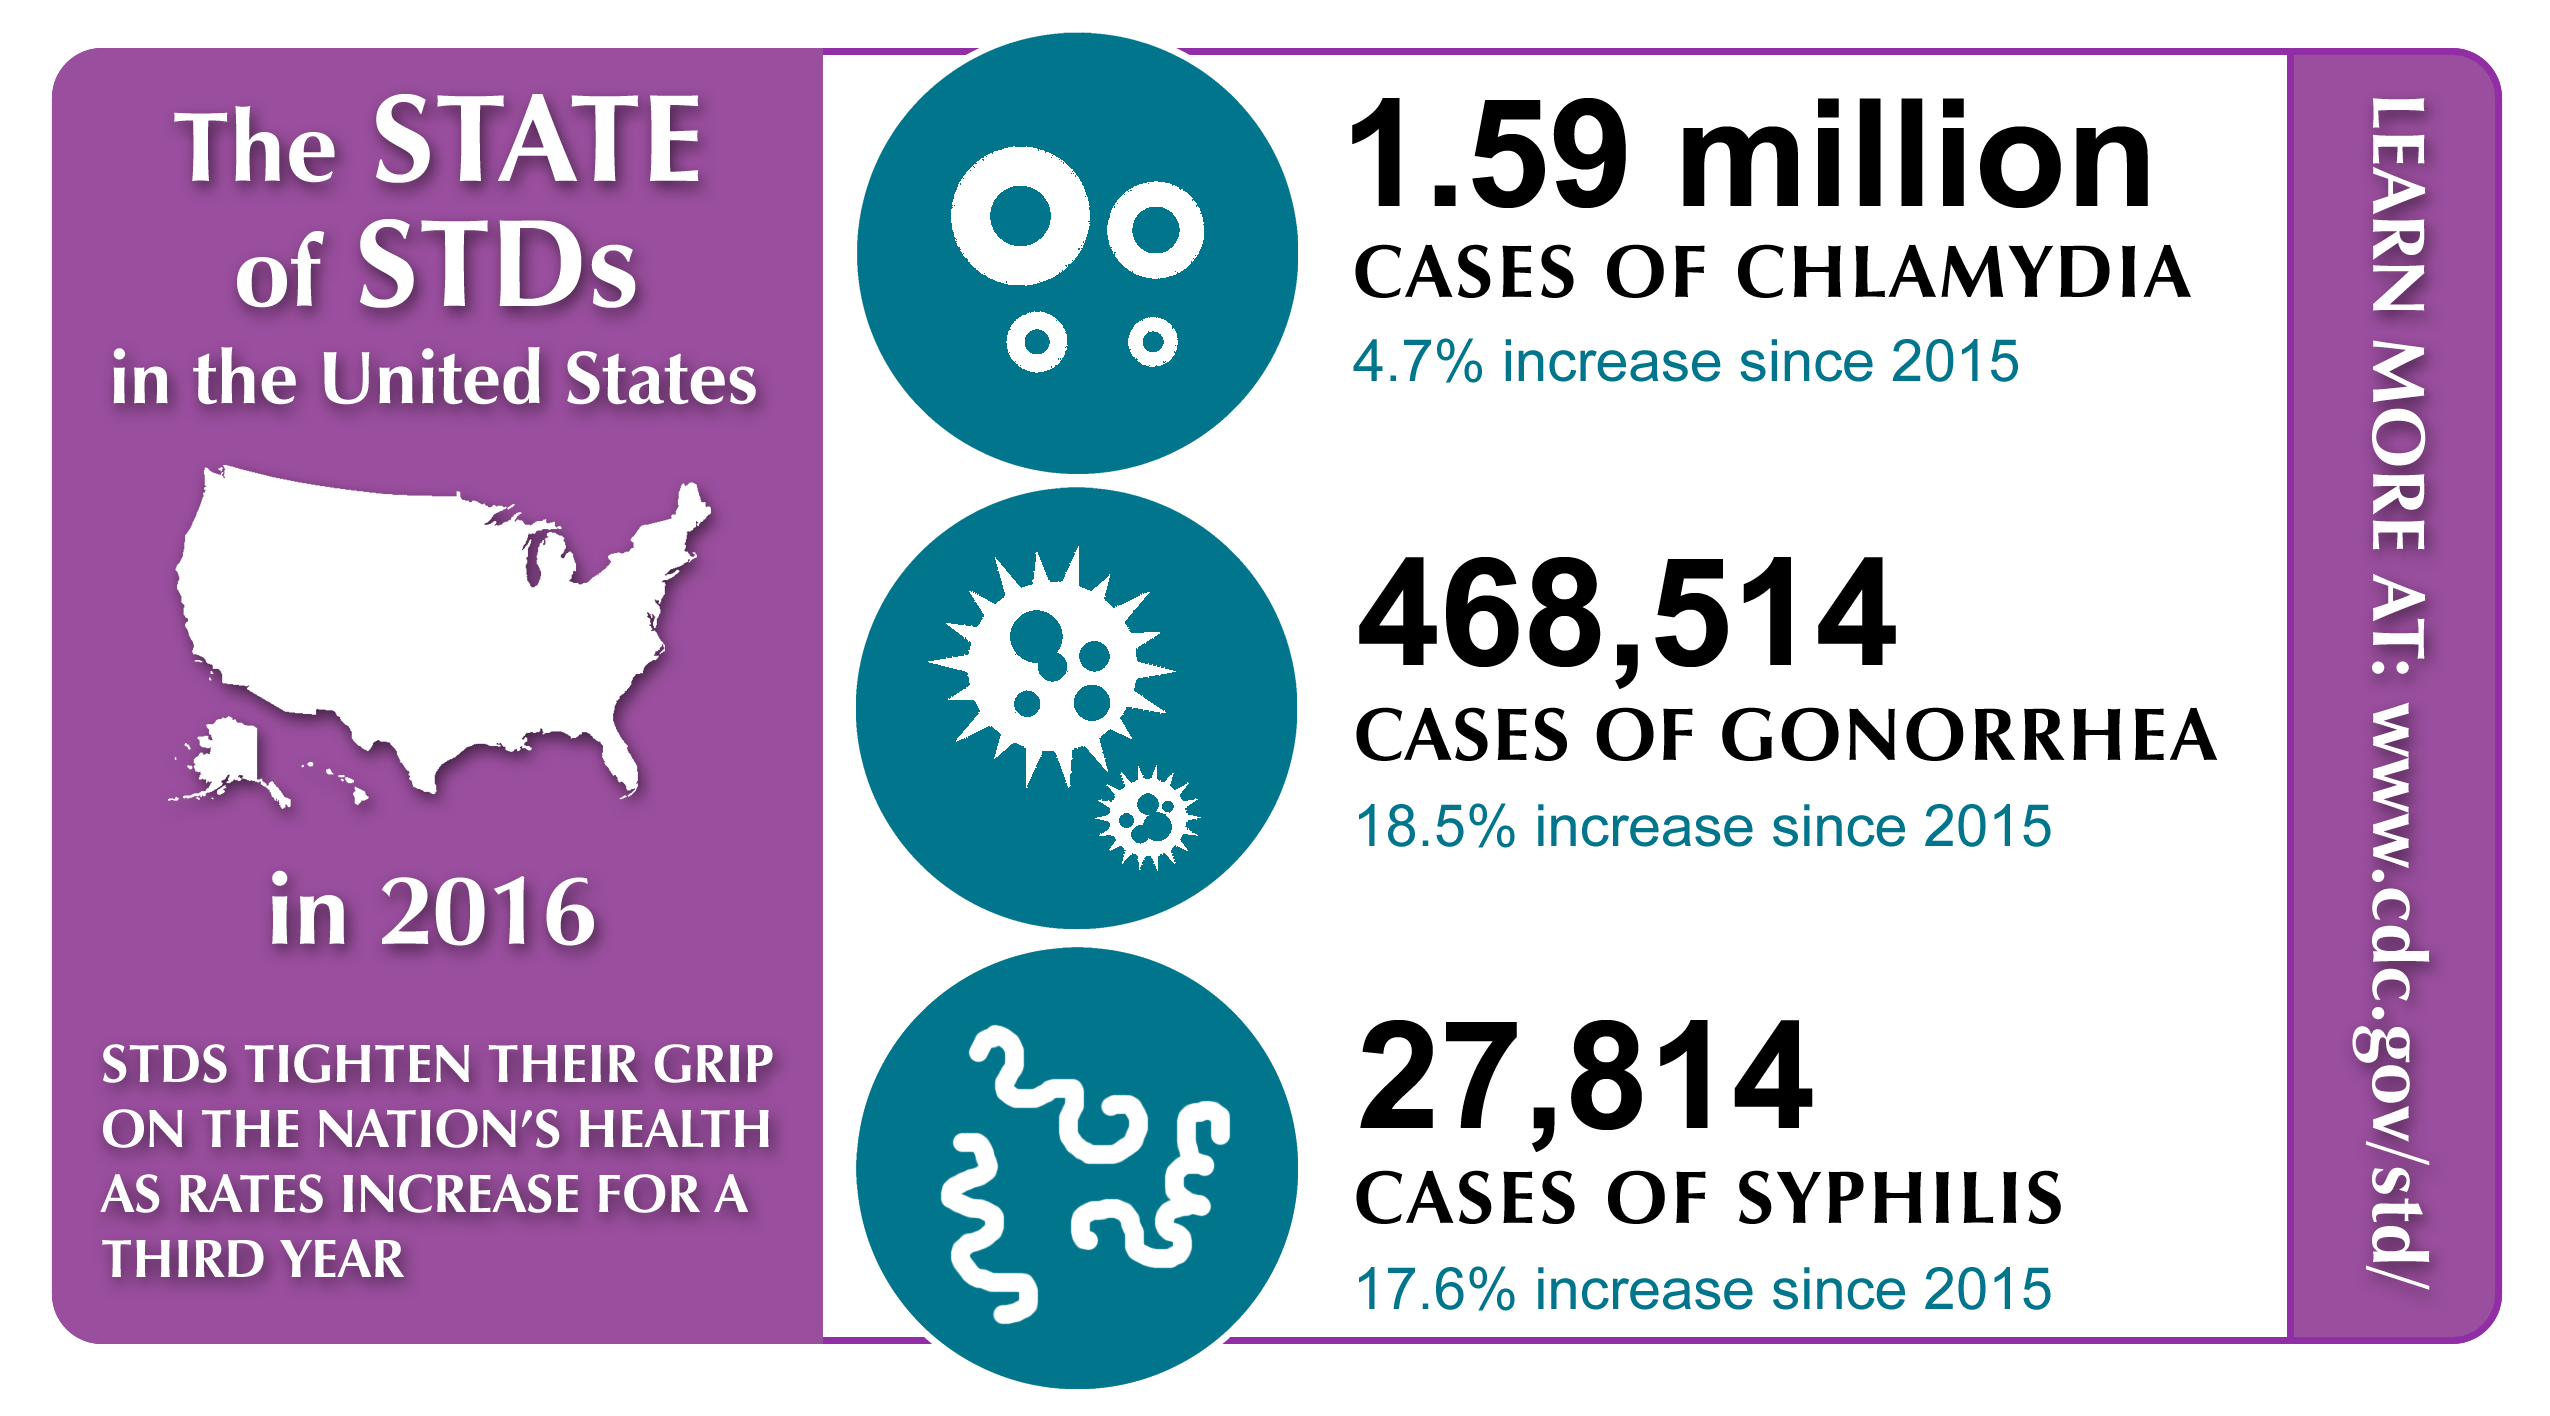
STDs Increase Across the Country for the Third Year
This page provides several resources for the 2016 STD Surveillance Report. You can browse the report online and access fact sheets, an infographic about the state of the STD epidemic, sample social media for Twitter and Facebook, social media graphics, and other useful information that you can adapt and use to communicate about the burden in your area. We will update this page as new resources become available, so be sure and keep coming back!

Highlights
Slides – PowerPoint slides of the graphs from 2016 Surveillance
Announcement from Dr. Gail Bolan [PDF – 278 KB]: CDC’s STD Director on the new report’s findings and what it will take to halt the growing STD burden.
Media Release: STDs at record high, indicating urgent need for prevention
State Ranking Tables [PDF – 82 KB] – Use tables 2, 13, 26, and 40 to understand what’s happening where you live.
State Profiles – Present an overview of the burden of HIV/AIDS, viral hepatitis, STDs, and TB in the U.S., all 50 states, and Washington D.C.
National Profile | Special Focus Profiles – These links will take you directly to figures in these sections of the report.
Fast Facts
Gonorrhea│ 468,514 cases; 18.5% rate increase since 2015
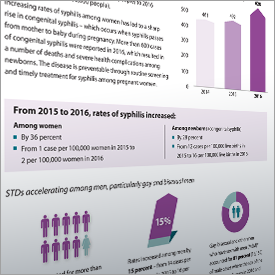
Primary and Secondary Syphilis│27,814 cases; 17.6% rate increase since 2015
Congenital Syphilis│628 cases; 27.6% rate increase since 2015
Chlamydia — Rates of Reported Cases Among Women by State, United States and Outlying Areas, 2016
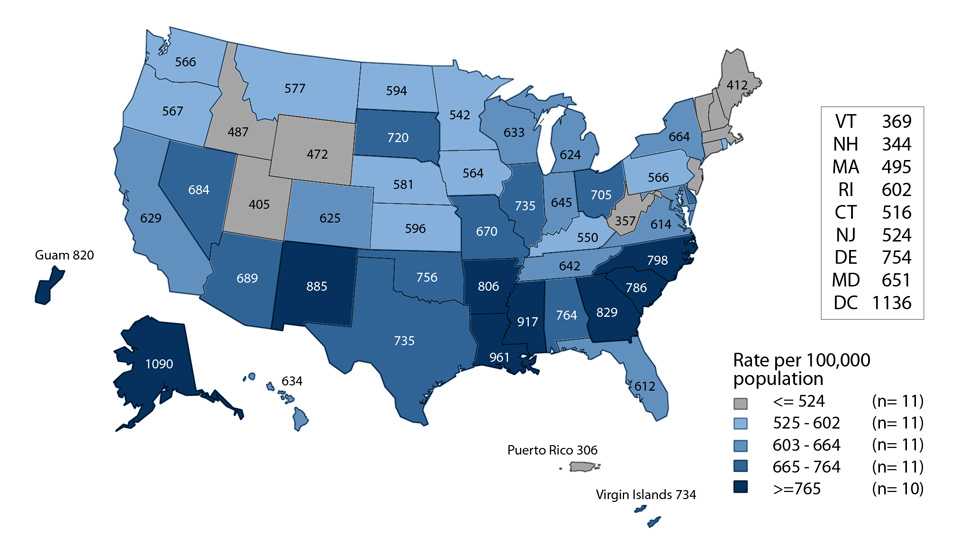
The burden of chlamydia is high among young women aged 15-24. Learn more about other affected populations.
Primary and Secondary Syphilis — Reported Cases* by Sex, Sexual Behavior, and Race/Ethnicity, United States, 2016
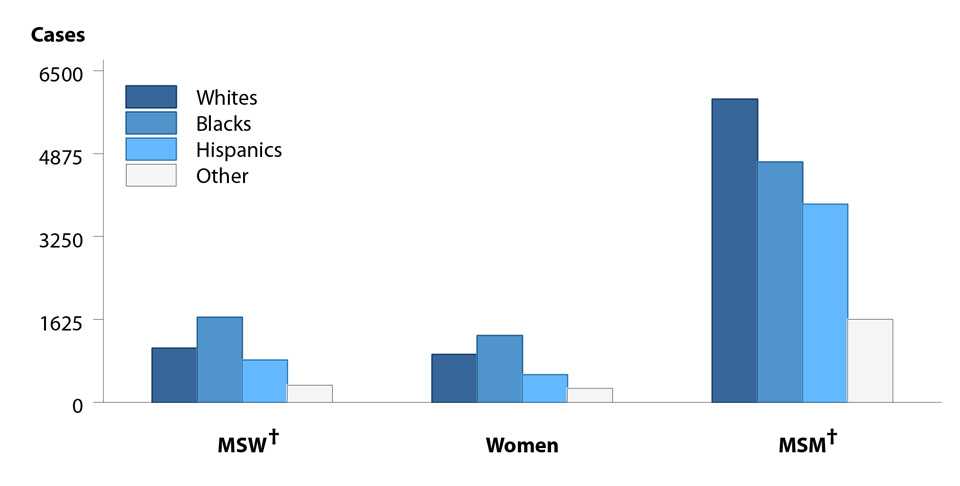
Gay and bisexual men face the highest burden of syphilis in the United States. Learn how syphilis is affecting other communities.
Social Media
- JUST RELEASED! CDC’s 2016 #STDreport finds #STD rates increase for a third year. Report & resources: https://go.usa.gov/xRMW6
- STD rates are climbing in the US. How does your neck of the woods stack up? https://go.usa.gov/xRMWF #STDreport
- What’s the state of #STDs in the US? This infographic explains: https://go.usa.gov/xRMWz #STDreport
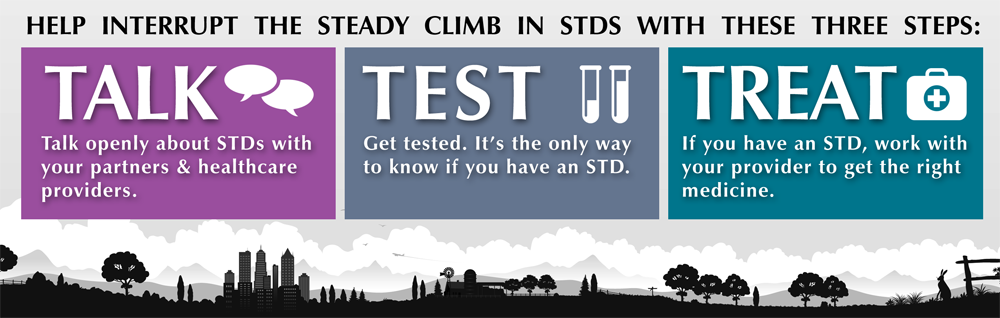
- You CAN interrupt the steady climb in #STD rates. Here’s how: https://go.usa.gov/xRMWJ #STDreport
- Clinicians: Protect patients from rising rates of #chlamydia, #gonorrhea & #syphilis. Here’s help: https://go.usa.gov/xRMWh #STDreport
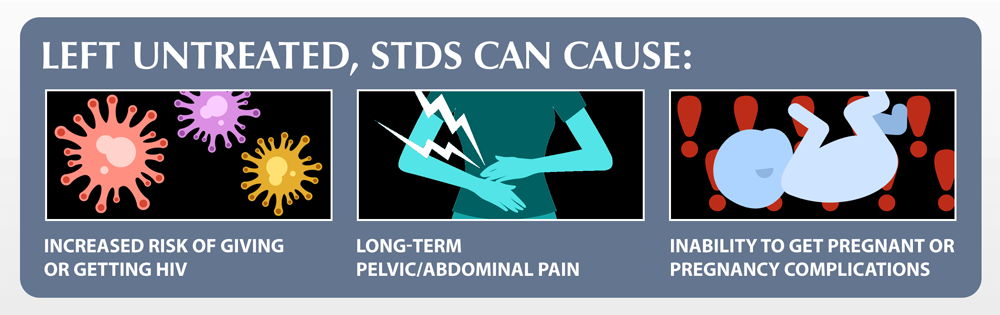
- Preventing #STDs is more than stopping disease, its safeguarding quality of life. Defend yours w/this: https://go.usa.gov/xRMZc #STDreport
- NEW! CDC’s 2016 #STDreport finds STDs tighten their grip on the nation’s health as chlamydia, gonorrhea, and syphilis increased for a third year: https://go.usa.gov/xRMZr
- This NEW infographic breaks down what’s happening with STDs in the US, the dangers of untreated STDs, and how to prevent them –> https://go.usa.gov/xRMZ4 #STDreport
- Rates for three common STDs increased in 2016. Find out what puts you at risk, what tests might be right for you, and where to get tested – all in one place: https://go.usa.gov/xRMZb #STDreport
- The number of babies born with syphilis in 2016 = 628. That’s the most cases seen in the US since 1998. Let’s change that! Here’s how: https://go.usa.gov/xRMZZ #STDreport
- CDC’s 2016 #STDreport Fact: Gay and bisexual men continue to face high rates of syphilis and HIV co-infection. Data also suggests gonorrhea rates have increased for five years. Let’s make sure men have information to protect themselves and their partners! https://go.usa.gov/xRMZK
Click to view full size; right-click to save.
Click to view full size; right-click to save.
Click to view full size; right-click to save.
A limited number of hard copies of the surveillance report are available. If you would like one or more hard copies, please send your request to sdmb@cdc.gov. These will be issued on a first come first serve basis.
- Page last reviewed: September 26, 2017
- Page last updated: October 17, 2017
- Content source: