

STDs in Adolescents and Young Adults
 ShareCompartir
Public Health Impact
Incidence and prevalence estimates suggest that young people aged 15–24 years acquire half of all new STDs1 and that one in four sexually active adolescent females has an STD, such as chlamydia or human papillomavirus (HPV).2 Compared with older adults, sexually active adolescents aged 15–19 years and young adults aged 20–24 years are at higher risk of acquiring STDs for a combination of behavioral, biological, and cultural reasons. For some STDs, such as chlamydia, adolescent females may have increased susceptibility to infection because of increased cervical ectopy. Cervical ectopy refers to columnar cells, which are typically found within the cervical canal, located on the outer surface of the cervix. Although this is a normal finding in adolescent and young women, these cells are more susceptible to infection. The higher prevalence of STDs among adolescents may also reflect multiple barriers to accessing quality STD prevention and management services, including inability to pay, lack of transportation, long waiting times, conflict between clinic hours and work and school schedules, embarrassment attached to seeking STD services, method of specimen collection, and concerns about confidentiality (e.g., Explanation of Benefits for services received mailed to parents or guardians).3
Traditionally, intervention efforts have targeted individual level factors associated with STD risk which do not address higher-level factors (e.g., peer norms and media influences) that may also influence behaviors.4 Interventions for at risk adolescents and young adults that address underlying aspects of the social and cultural conditions affecting sexual risk-taking behaviors are needed, as are strategies designed to improve the underlying social conditions themselves.5,6 In addition, in designing STD programs, consideration should be given to the needs of adolescent and young adult populations including extended hours, optimizing privacy in waiting rooms, and urine based specimen collection.3
Observations
Chlamydia
In 2016, there were 1,008,403 reported cases of chlamydial infection among persons aged 15–24 years, representing 63.1% of all reported chlamydia cases. Among those aged 15–19 years, the rate of reported cases of chlamydia increased 4.0% during 2015–2016 (1,854.2 to 1,929.2 cases per 100,000 population) (Table 10). Among those aged 20–24 years, the rate increased 1.9% during 2015–2016 (2,594.5 to 2,643.8 cases per 100,000 population) (Table 10).
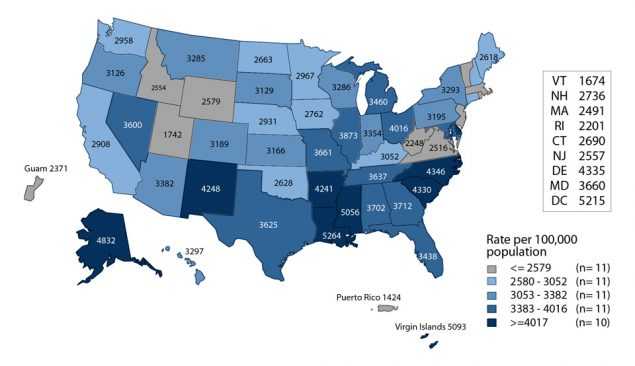
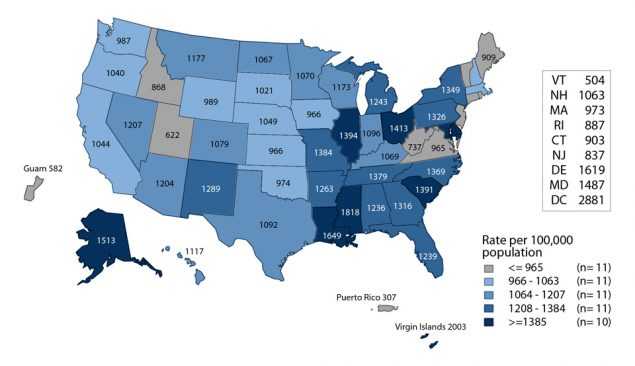
Among women aged 15–24 years, the population targeted for chlamydia screening, the overall rate of reported cases of chlamydia was 3,437.5 cases per 100,000 females. Among men aged 15–24 years, the overall rate of reported cases of chlamydia was 1,209.6 cases per 100,000 males. Rates varied by state for both males and females, with the majority of states having the highest reported case rates in the South (Figures J and K).
15–19 Year Old Females — In 2016, the rate of reported chlamydia cases among women aged 15–19 years was 3,070.9 cases per 100,000 females, a 2.8% increase from the 2015 rate of 2,986.5 cases per 100,000 females (Table 10). Increases in rates of reported cases of chlamydia during 2015–2016 were largest among 16–year old and 18–year old women (3.4% and 4.1% increases, respectively) (Table 12). During 2012–2016, the overall rate of reported cases for women aged 15–19 years decreased 7.8% (Table 10).
20–24 Year Old Females — In 2016, women aged 20–24 years had the highest rate of reported chlamydia cases (3,779.0 cases per 100,000 females) compared with any other age group for either sex (Figure 5, Table 10). During 2015–2016, the overall rate of reported chlamydia cases among women in this age group remained relatively stable; however, this rate increased 4.1% during 2012–2016 (Table 10).
15–19 Year Old Males — In 2016, the rate of reported chlamydia cases among men aged 15–19 years was 832.6 cases per 100,000 males, an 8.6% increase from 2015. During 2012–2016, the rate of reported chlamydia cases for men aged 15–19 years increased 6.0% (Table 10).
20–24 Year Old Males — In 2016, as in previous years, men aged 20–24 years had the highest rate of reported chlamydia cases among all men (1,558.6 cases per 100,000 males). The rate for men in this age group increased 5.5% during 2015–2016 (Table 10). Similarly, during 2012–2016, the rate for men aged 20–24 years increased 17.8% (Table 10).
Gonorrhea
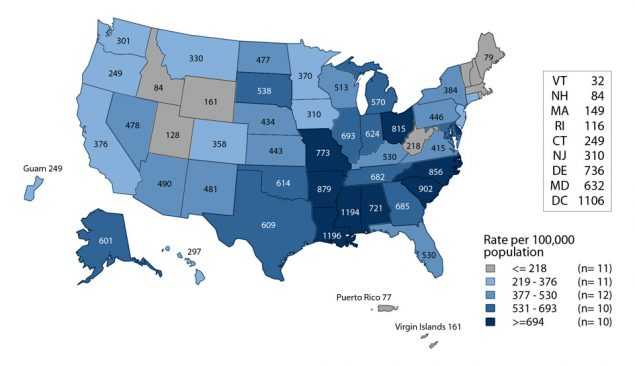
During 2015–2016, the rate of reported gonorrhea cases increased 11.3% for persons aged 15–19 years and 10.9% for persons aged 20–24 years (Table 21). In 2016, among women aged 15–24 years, the rate was 540.8 cases per 100,000 females and among men aged 15–24 years, the rate was 455.3 cases per 100,000 males. For both women and men, rates varied by state. The majority of states with the highest reported case rates were in the South (Figures L and M).
15–19 Year Old Females — In 2016, women aged 15–19 years had the second highest rate of reported gonorrhea cases (482.1 cases per 100,000 females) compared with other age groups among women (Figure 17, Table 21). During 2015–2016, the rate of reported gonorrhea cases for women in this age group increased 9.3% and decreased 8.6% during 2012–2016 (Table 21).
20–24 Year Old Females — In 2016, women aged 20–24 years had the highest rate of reported gonorrhea cases (595.5 cases per 100,000 females) compared with other age groups among women (Figure 17, Table 21). During 2015–2016, the rate of reported gonorrhea for women in this age group increased 7.9% and 4.8% during 2012–2016 (Table 21).
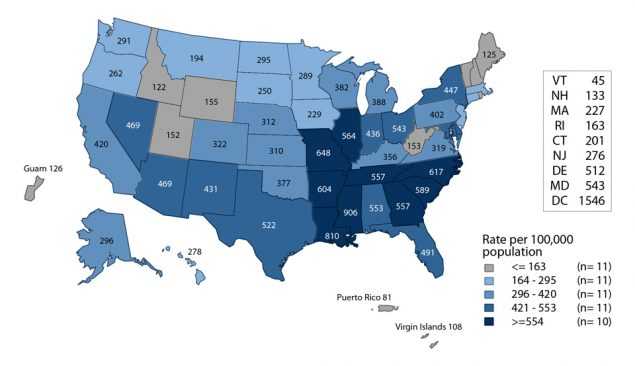
15–19 Year Old Males — In 2016, the rate of reported gonorrhea cases among men aged 15–19 years was 280.8 cases per 100,000 males (Figure 17, Table 21). During 2015–2016, the rate of reported gonorrhea cases for men in this age group increased 14.8% and 15.8% during 2012–2016 (Table 21).
20–24 Year Old Males — In 2016, as in previous years, men aged 20–24 years had the highest rate of reported gonorrhea cases (616.8 cases per 100,000 males) compared with any other age group for either sex (Figure 17, Table 21). During 2015–2016, the rate of reported gonorrhea for men in this age group increased 13.7% and 36.1% during 2012–2016 (Table 21).
Primary and Secondary Syphilis
During 2015–2016, the rate of reported primary and secondary (P&S) syphilis cases increased 13.0% among persons aged 15–19 years and 8.1% among persons aged 20–24 years (Table 34).
15–19 Year Old Females — The rate of reported P&S syphilis cases among women aged 15–19 years decreased each year during 2009–2013 (from 3.3 to 1.9 cases per 100,000 females) (Figure 38, Table 34). However, the rate has subsequently increased each year since then. During 2015–2016, the rate increased 22.2%, from 2.7 to 3.3 cases per 100,000 females (Figure 38, Table 34).
20–24 Year Old Females — In 2016, women aged 20–24 years had the highest rate of P&S syphilis (6.7 cases per 100,000 females) compared with other age groups among women (Figure 37, Table 34). The P&S syphilis rate among women in this age group has increased each year since 2011 (Figure 38, Table 34). During 2015–2016, the rate increased 28.8%. 15–19 Year Old Males — In 2016, the rate of reported P&S syphilis cases among men aged 15–19 years was 8.9 cases per 100,000 males (Figure 37, Table 34). The P&S syphilis rate among men in this age group has increased each year since 2011 (Figure 39, Table 34). During 2015–2016, the rate increased 11.3%.
20–24 Year Old Males — In 2016, men aged 20–24 years had the second highest rate of reported P&S syphilis (37.9 cases per 100,000 males) compared with any other age group for either sex (Figure 37, Table 34). The P&S syphilis rate among men in this age group has increased each year since 2006 (Figure 39, Table 34). During 2015–2016, the rate increased 5.6%.
National Job Training Program
The National Job Training Program (NJTP) is an educational program for socioeconomically disadvantaged youth aged 16–24 years and is administered at more than 100 sites throughout the country. The NJTP screens participants for chlamydia and gonorrhea within two days of entry to the program. All of NJTP’s chlamydia screening tests and the majority of gonorrhea screening tests are conducted by a single national contract laboratory*.
To increase the stability of the estimates, chlamydia or gonorrhea prevalence data are presented when valid test results for 100 or more students per year are available for the population subgroup and state. Additional information about NJTP can be found in Section A2.1 in the Appendix.
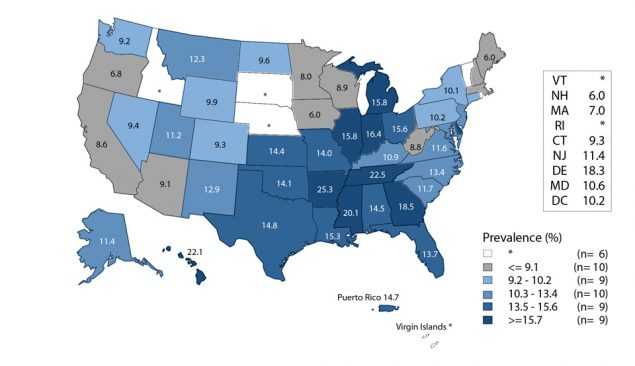
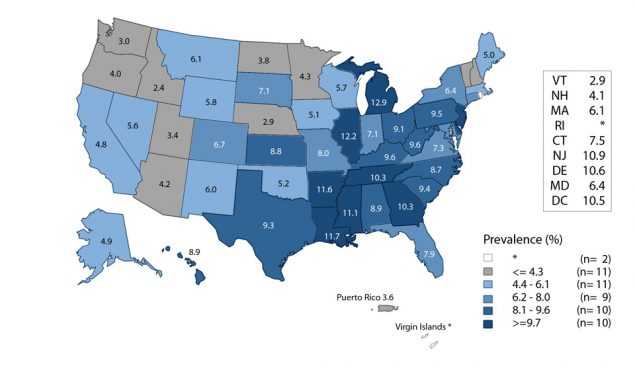
Among women entering the program in 45 states, the District of Columbia, and Puerto Rico, the median state specific chlamydia prevalence in 2016 was 11.4% (range: 6.0% to 25.3%) (Figure N). Among men entering the program in 49 states, the District of Columbia, and Puerto Rico, the median state-specific chlamydia prevalence was 7.1% (range: 2.4% to 12.9%) (Figure O).
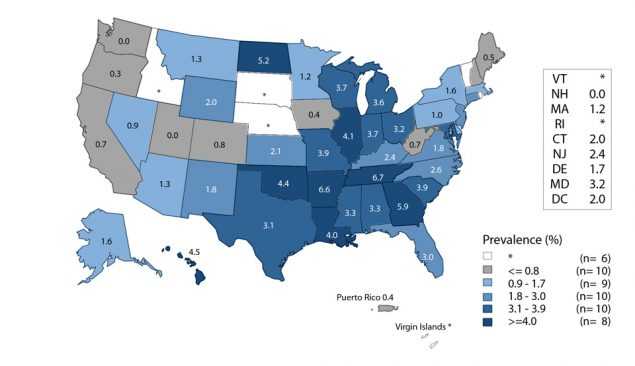
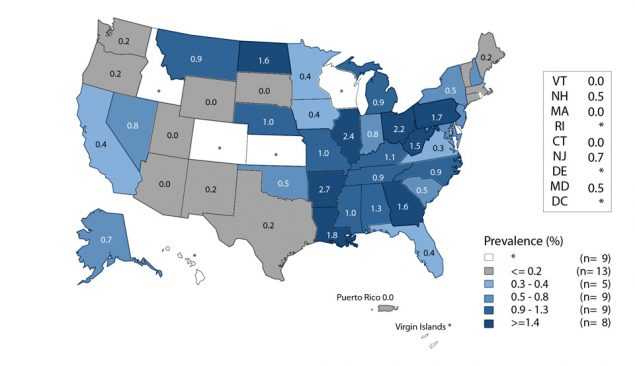
Among women entering the program in 45 states, the District of Columbia, and Puerto Rico, the median state specific gonorrhea prevalence in 2016 was 2.0% (range: 0.0% to 6.7%) (Figure P). Among men entering the the median state-specific gonorrhea prevalence was 0.5% (range: 0.0% to 2.7%) (Figure Q).
Adolescents and Young Adults Summary
The rate of reported cases of chlamydia, gonorrhea, and P&S syphilis increased for both sexes in both the adolescent (15–19 years) and young adult (20–24 years) age groups during 2012–2016. For chlamydia, rates of reported cases are consistently highest among women aged 15–24 years, likely reflecting targeted screening of young women; however, the rate of reported chlamydia in males increased 14.0% during 2012–2016, while the rate in females decreased 1.4%. Similarly, in 2016, the rate of reported cases of gonorrhea in females aged 15–24 years was higher than in men of the same age group; however, during 2012–2016, the rate of reported gonorrhea in males aged 15–24 years increased 29.9%, while the rate in females decreased 1.4%. Increases in chlamydia and gonorrhea diagnoses among men likely reflect a combination of increased screening among young men, including extragenital screening, and increased incidence. Conversely, rates of reported cases of P&S syphilis have been consistently higher among adolescent and young adult men compared to women, and during 2012–2016, rates of reported P&S syphilis cases increased substantially in both adolescent and young adult males and females, with 54.2% and 64.5% increases, respectively.
* Laboratory tests are conducted by the Center for Disease Detection, LLC San Antonio, Texas.
References
1. Satterwhite CL, Torrone E, Meites E, et al. Sexually transmitted infections among US women and men: prevalence and incidence estimates, 2008. Sex Trans Dis 2013; 40(3)187–193.
2. Forhan SE, Gottlieb SL, Sternberg MR, et al. Prevalence of sexually transmitted infections among female adolescents aged 14 to 19 in the United States. Pediatrics 2009; 124(6):1505–1512.
3. Tilson EC, Sanchez V, Ford CL, et al. Barriers to asymptomatic screening and other STD services for adolescents and young adults: focus group discussions. BMC Public Health 2004; 4(1):21.
4. DiClemente RJ, Salazar LF, Crosby RA. A review of STD/HIV preventive interventions for adolescents: sustaining effects using an ecological approach. J Pediatr Psychol 2007; 32(8):888–906.
5. Sieving RE, Bernat DH, Resnick MD, et al. A clinic-based youth development program to reduce sexual risk behaviors among adolescent girls: prime time pilot study. Health Promot Pract 2012; 13(4):462–471.
6. Upchurch DM, Mason WM, Kusunoki Y, et al. Social and behavioral determinants of self reported STD among adolescents. Perspect Sex Reprod Health 2004; 36(6):276–287.
- Page last reviewed: September 26, 2017
- Page last updated: September 26, 2017
- Content source: