

STDs in Racial and Ethnic Minorities
 ShareCompartir
Public Health Impact
Surveillance data show higher rates of reported STDs among some racial or ethnic minority groups when compared with rates among Whites.1,2 Race and Hispanic ethnicity in the United States are population characteristics that are correlated with other factors affecting health status such as unemployment and low educational attainment.3-5 In 2015, the overall proportion of the United States population living in poverty was 14.7% (or 48.2 million) and decreased slightly from 2014. Although the overall poverty rate is currently stable, many Americans face challenges overcoming inequalities in economic opportunity. The poverty rate in 2015 for Whites was 9.1% (17.7 million), for Blacks it was 24.1% (or 10.0 million), and for Hispanics it was 21.4% (or 13.1 million).3 Those who cannot afford basic life necessities often have trouble accessing and affording quality sexual health services.6 People who struggle financially are often experiencing life circumstances that potentially increase their risk for STDs.6
Access to quality STD prevention and treatment services is key to reducing STD disparities in the United States. Of the estimated 19 million new cases of sexually transmitted infections that occur each year, approximately half of the cases occur among people aged 15–24 years.7 Although the overall proportion of adults without health insurance decreased from 13.3% in 2013 to 9.1% (or 29.0 million) in 2015, many people in the United States continue to lack access to health care.8 Among all races and ethnicities in the United States, Hispanics had the lowest rate of health insurance coverage in 2015 at 83.8%.8
Even when health care is available, fear and distrust of health care institutions can negatively affect the health care-seeking experience for many racial/ethnic minorities when there is social discrimination, provider bias, or the perception that these may exist.9,10 Moreover, the quality of care can differ substantially for minority patients.11 Inequities in social and economic conditions are reflected in the profound disparities observed in the incidence of STDs among some racial and ethnic minorities.
In communities where STD prevalence is higher because of these factors, persons can experience difficulties reducing their risk for sexually transmitted infections. With each sexual encounter, they can face a greater chance of encountering an infected partner than those in lower prevalence settings.2 Acknowledging inequities in STD rates by race or ethnicity is one of the first steps in empowering affected communities to organize and focus on this problem.
STD Reporting Practices
Surveillance data are based on cases of STDs reported to state and local health departments (see Section A.1 in the Appendix). In many state and local health departments, electronic laboratory reporting is increasingly a primary source of initial case notification. The reports are often missing race and ethnicity of the patient; ascertainment of information on race and Hispanic ethnicity is therefore a function of active follow-up or dependent on previous information available about the patient in existing health department surveillance databases. Prevalence data from populationbased surveys, such as the National Health and Nutrition Examination Survey (NHANES) and the National Longitudinal Study of Adolescent Health, confirm the existence of marked STD disparities in some minority populations.12,13
Method of Classifying Race and Hispanic Ethnicity
Interpretation of racial and ethnic disparities among persons with STDs is influenced by data collection methods and by the categories by which these data are displayed. Race/ethnicity data are presented in Office of Management and Budget (OMB) race and ethnicity categories according to the 1997 revised OMB standards.14 However, the National Center for Health Statistics (NCHS) bridged-race categories are used where OMB categories are not available (i.e., congenital syphilis). As of 2016, all reporting jurisdictions collect and report data in OMB-compliant formats for syphilis, chlamydia, and gonorrhea. Historical trend and rate data by race and Hispanic ethnicity displayed in figures and interpreted in this report for 2012–2016 include only those states and/or reporting jurisdictions (46 jurisdictions for chlamydia, gonorrhea, and syphilis) reporting in the current standard consistently for all years from 2012 through 2016 (See Section A1.5 of the Appendix for additional information on reporting of race and Hispanic ethnicity).
Completeness of Race/Ethnicity Data in 2016
Chlamydia — 28.8% of chlamydia case reports were missing race or ethnicity data, ranging by jurisdiction from 0.1% to 76.6% (Table A1).
Gonorrhea — 19.0% of gonorrhea case reports were missing information on race or ethnicity, ranging by jurisdiction from 0.1% to 69.9% (Table A1).
Syphilis — 3.8% of all primary and secondary (P&S) syphilis case reports were missing information on race or ethnicity, ranging from no missing cases to 30.4% missing information on race or ethnicity among jurisdictions with 10 or more cases of P&S syphilis (Table A1).
Observations
Chlamydia
Among the 46 states that submitted data on race and ethnicity for chlamydia cases each year during 2012–2016 according to the OMB standards, rates of reported chlamydia cases increased during that time frame among Whites (12.7%), Asians (10.2%), Native Hawaiians/Other Pacific Islanders (NHOPI) (8.3%), and Multirace (60.6%), and decreased in American Indians/Alaska Natives (AI/AN) (-6.4%) and Blacks (-3.5%) (Figure 6). Rates were stable among Hispanics during 2012–2016.
In 2016, 50 states and the District of Columbia submitted data on race and ethnicity for chlamydia cases according to the OMB standards.
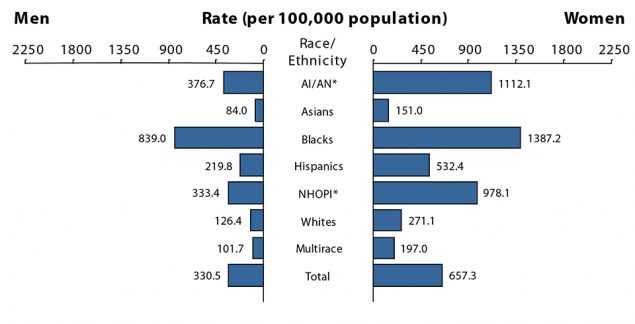
Blacks — In 2016, the overall rate of reported chlamydia cases among Blacks in the United States was 1,125.9 cases per 100,000 population (Table 11B). The rate of reported chlamydia cases among Black women was 5.1 times the rate among White women (1,387.2 and 271.1 cases per 100,000 females, respectively) (Figure R and Table 11B). The rate of reported chlamydia cases among Black men was 6.6 times the rate among White men (839.0 and 126.4 cases per 100,000 males, respectively). Rates of reported cases of chlamydia were highest for Blacks aged 15–19 and 20–24 years in 2016 (Table 11B). The rate of reported chlamydia cases among Black women aged 15–19 years (6,485.2 cases per 100,000 females) was 4.5 times the rate among White women in the same age group (1,433.3 cases per 100,000 females). The rate of reported chlamydia cases among Black women aged 20–24 years was 3.7 times the rate among White women in the same age group (6,747.6 and 1,836.2 cases per 100,000 females, respectively) (Table 11B).
Similar racial disparities in reported chlamydia rates exist among men. Among men aged 15–19 years, the rate of reported chlamydia cases among Blacks was 8.8 times the rate among Whites (2,337.7 and 266.9 cases per 100,000 males, respectively) (Table 11B). The rate of reported chlamydia cases among Black men aged 20–24 years was 4.9 times the rate among White men of the same age group (3,316.9 and 682.5 cases per 100,000 males, respectively).
American Indians/Alaska Natives — In 2016, the rate of reported chlamydia cases among AI/AN was 749.8 cases per 100,000 population (Table 11B). Overall, the rate of AN in the United States was 3.8 times the rate among Whites.
Native Hawaiians/Other Pacific Islanders — In 2016, the rate of reported chlamydia cases among NHOPI was 653.4 cases per 100,000 population (Table 11B). The overall rate of reported chlamydia cases among NHOPI was 3.3 times the rate among Whites and 5.5 times the rate among Asians.
Hispanics — In 2016, the rate of reported chlamydia cases among Hispanics was 374.6 cases per 100,000 population, which was 1.9 times the rate among Whites (Table 11B).
Asians — In 2016, the rate of reported chlamydia cases among Asians was 119.3 cases per 100,000 population (Table 11B). The overall rate of reported chlamydia cases among Whites was 1.7 times the rate among Asians.
Gonorrhea
Among 46 states submitting race and ethnicity data for gonorrhea cases consistently according to OMB standards each year during 2012–2016, rates of reported gonorrhea cases increased 120.4% among Multirace persons (25.0 to 55.1 cases per 100,000 population), 91.4% among NHOPI (84.4 to 161.5 cases per 100,000 population), 82.5% among Whites (31.4 to 57.3 cases per 100,00 population), 81.3% among AI/ AN (125.8 to 228.1 cases per 100,000 population), 76.7% among Asians (16.3 to 28.8 cases per 100,000 population), 61.8% among Hispanics (59.4 to 96.1 cases per 100,000 population), and 10.5% among Blacks (455.3 to 503.2 cases per 100,000 population) (Figure 20).
In 2016, 50 states and the District of Columbia submitted data on race and ethnicity for gonorrhea cases according to the OMB standards.
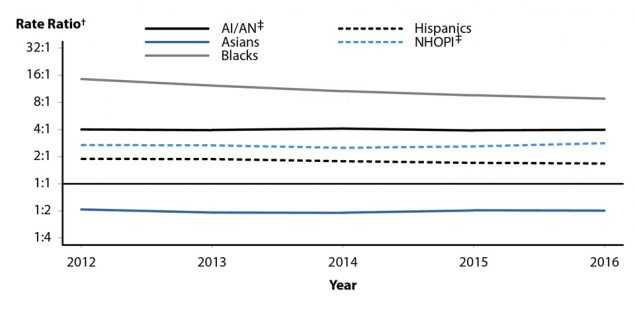
Blacks — In 2016, 51.0% of reported gonorrhea cases with known race and ethnicity occurred among Blacks (excluding cases with missing information on race or ethnicity, and cases whose reported race or ethnicity was Other) (Table 22A). The rate of reported gonorrhea cases among Blacks in 2016 (481.2 cases per 100,000 population) was 8.6 times the rate among Whites (55.7 cases per 100,000 population) (Table 22B). Although the calculated rate ratio for 2016 differs when considering only the 46 jurisdictions that submitted data in race and ethnicity categories according to the OMB standards for each year during 2012–2016, this disparity has decreased slightly in recent years (Figure S). In 2016, this disparity was similar for Black men (8.9 times the rate among White men) and Black women (8.4 times the rate among White women) (Figure T, Table 22B). As in previous years, the disparity in gonorrhea rates for Blacks in 2016 was larger in the Midwest and Northeast than in the South and West (Figure U).
Considering all race, ethnicity, and age categories, rates of reported gonorrhea cases were highest for Blacks aged 20–24, 15–19, and 25–29 years in 2016 (Table 22B). The rate of reported gonorrhea cases among Black women aged 20–24 years (1,856.5 cases per 100,000 females) was 8.0 times the rate among White women in the same age group (232.0 cases per 100,000 females). The rate of reported gonorrhea cases among Black women aged 15–19 years (1,663.1 cases per 100,000 females) was 10.3 times the rate among White women in the same age group (161.9 cases per 100,000 females). Among Black men aged 20–24 years, the rate of reported gonorrhea cases (1,892.7 cases per 100,000 males) was 9.1 times the rate among White men in the same age group (207.0 cases per 100,000 males). The rate of reported gonorrhea cases among Black men aged 25–29 years (1,641.0 cases per 100,000 males) was 7.4 times the rate among White men in the same age group (222.3 cases per 100,000 males).
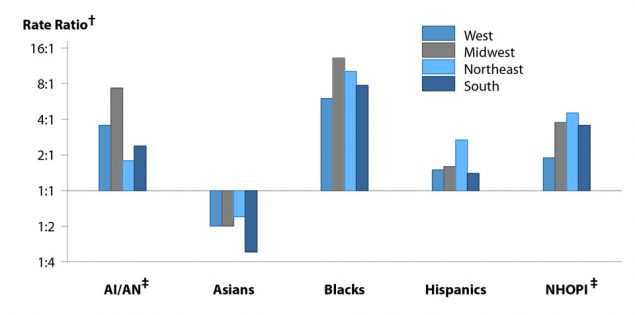
American Indians/Alaska Natives — In 2016, the rate of reported gonorrhea cases among AI/AN (242.9 cases per 100,000 population) was 4.4 times the rate among Whites (Table 22B). The disparity between gonorrhea rates for AI/AN and Whites was larger for AI/AN women (6.1 times the rate among White women) than for AI/AN men (3.1 times the rate among White men) (Figure T, Table 22B). The disparity in gonorrhea rates for AI/AN in 2016 was larger in the Midwest than in the West, Northeast, and South (Figure U).
Native Hawaiians/Other Pacific Islanders — In 2016, the rate of reported gonorrhea cases among NHOPI (165.8 cases per 100,000 population) was 3.0 times the rate among Whites (Table 22B). The disparity between gonorrhea rates for NHOPI and Whites was larger for NHOPI women (3.4 times the rate among White women) than NHOPI men (2.7 times the rate among White men) (Figure T, Table 22B). The disparity in gonorrhea rates for NHOPI in 2016 was lower in the West than in the Midwest, Northeast, or South (Figure U). Hispanics — In 2016, the rate of reported gonorrhea cases among Hispanics was 95.9 cases per 100,000 population, which was 1.7 times the rate among Whites (Table 22B). This disparity was similar for Hispanic women (1.6 times the rate among White women) and Hispanic men (1.8 times the rate among White men) (Figure T, Table 22B). The disparity in gonorrhea rates for Hispanics in 2016 was higher in the Northeast than in the Midwest, South, or West (Figure U).
Asians — In 2016, the rate of reported gonorrhea cases among Asians (28.3 cases per 100,000 population) was 0.5 times the rate among Whites (Table 22B). This difference is larger for Asian women than for Asian men (Figure T, Table 22B). In 2016, rates among Asians were lower than rates among Whites in all four regions of the United States (Figure U).
Primary and Secondary Syphilis
During 2012–2016, 46 states submitted race and ethnicity data for syphilis each year according to the OMB standards. In these states, rates of reported P&S syphilis cases increased 186.2% among AI/ AN (2.9 to 8.3 cases per 100,000 population), 147.4% among those who identified as Multirace (1.9 to 4.7 cases per 100,000 population), 105.3% among Asians (1.9 to 3.9 cases per 100,000 population), 91.1% among Hispanics (5.6 to 10.7 cases per 100,000 population), 77.8% among Whites (2.7 to 4.8 cases per 100,000 population), 61.6% among NHOPI (8.6 to 13.9 cases per 100,000 population), and 43.8% among Blacks (16.2 to 23.3 cases per 100,000 population) (Figure 40).
In 2016, all 50 states and the District of Columbia submitted syphilis data by race and ethnicity according to the OMB standards.
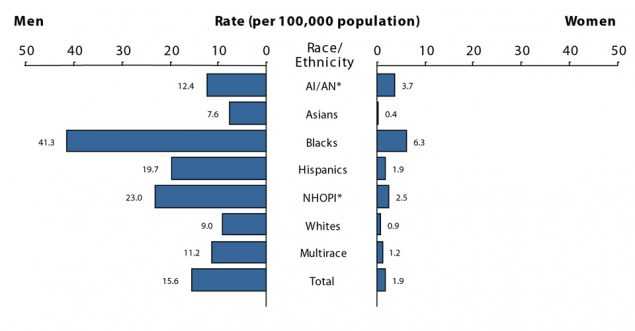
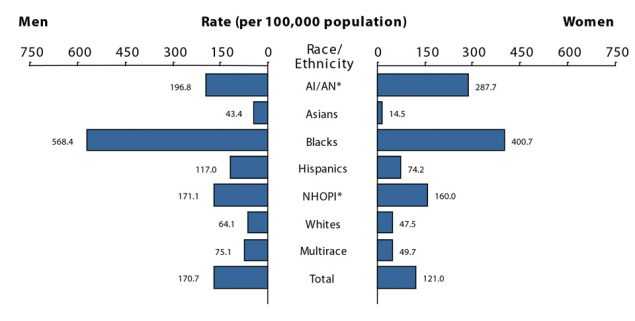
Blacks — In 2016, 36.6% of reported P&S syphilis cases with known race and ethnicity occurred among Blacks (excluding cases with missing information on race or ethnicity, and cases whose reported race or ethnicity was Other) (Table 35A). The rate of reported P&S syphilis cases among Blacks in 2016 (23.1 cases per 100,000 population) was 4.7 times the rate among Whites (4.9 cases per 100,000 population) (Table 35B). The disparity was higher for Black women (7.0 times the rate among White women) than for Black men (4.6 times the rate among White men) (Figure V, Table 35B). Considering all race, ethnicity, sex, and age categories, rates of reported P&S syphilis cases were highest among Black men aged 20–24 years and 25–29 years in 2016 (Table 35B). The rate of reported P&S syphilis cases among Black men aged 20–24 years (105.0 cases per 100,000 males) was 6.4 times the rate among White men in the same age group (16.4 cases per 100,000 males). The rate of reported P&S syphilis cases among Black men aged 25–29 years (144.6 cases per 100,000 males) was 6.2 times the rate among White men in the same age group (23.5 cases per 100,000 males).
Native Hawaiians/Other Pacific Islanders — In 2016, the rate of reported P&S syphilis cases among NHOPI was 12.9 cases per 100,000 population, which was 2.6 times the rate among Whites (Table 35B). This disparity was similar for NHOPI women (2.8 times the rate among White women) and NHOPI men (2.6 times the rate among White men).
American Indians/Alaska Natives — In 2016, the rate of reported P&S syphilis cases among AI/AN (8.0 cases per 100,000 population) was 1.6 times the rate among Whites (Table 35B). This disparity was larger for AI/AN women (4.1 times the rate among White women) than for AI/AN men (1.4 times the rate among White men).
Hispanics — In 2016, the rate of reported P&S syphilis cases among Hispanics (10.9 cases per 100,000 population) was 2.2 times the rate among Whites (Table 35B). This disparity was similar for Hispanic women (2.1 times the rate among White women) and Hispanic men (2.2 times the rate among White men).
Asians — In 2016, the rate of reported P&S syphilis cases among Asians was 3.9 cases per 100,000 population, which was 0.8 times the rate among Whites (Table 35B). This difference was larger for Asian women (0.4 times the rate among White women) than for Asian men (0.8 times the rate among White men).
Congenital Syphilis
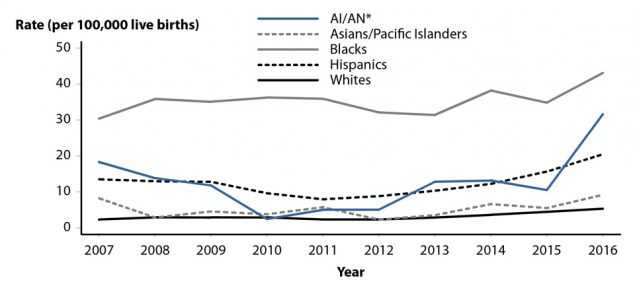
Race and ethnicity for cases of congenital syphilis is based on the mother’s race and ethnicity. During 2015–2016, rates of reported congenital syphilis cases increased in all race and ethnicity groups. Rates increased 201% among AI/AN, 67.3% among Asians/Pacific Islanders, 31.4% among Hispanics, 23.5% among Blacks, and 17.8% among Whites (Figure W, Table 42).
In 2016, 43.0% of congenital syphilis cases with known race and ethnicity occurred among Blacks (excluding cases with missing information on race or ethnicity, and cases whose reported race or ethnicity was ‘Other’) (Table 42). The rate of reported cases of congenital syphilis among Blacks in 2016 (43.1 cases per 100,000 live births) was 8.1 times the rate among Whites (5.3 cases per 100,000 live births). The rate of reported cases of congenital syphilis was 31.6 cases per 100,000 live births among AI/AN (6.0 times the rate among Whites), 20.5 cases per 100,000 live births among Hispanics (3.9 times the rate among Whites), and 9.2 cases per 100,000 live births among Asians/Pacific Islanders (1.7 times the rate among Whites).
References
1. Newman LM, Berman SM. Epidemiology of STD Disparities in African American Communities. Sex Transm Dis 2008; 35(12):S4–S12.
2. Hogben M, Leichliter JS. Social determinants and sexually transmitted disease disparities. Sex Transm Dis 2008; 35(12 Suppl):S13–18.
3. U.S. Census Bureau, Current Population Survey, 2016 Annual Social and Economic Supplement. Available at: https://www.census.gov/data/tables/time-series/demo/income-poverty/cps-pov/pov-01.2015.html#par_textimage_10 Accessed July 31, 2017.
4. Harling G, Subramanian SV, Barnighausen T, et al. Socioeconomic disparities in sexually transmitted infections among young adults in the United States: Examining the interaction between Income and race/ethnicity. Sex Transm Dis 2013; 40(7):575–581.
5. Centers for Disease Control and Prevention. CDC Health Disparities and Inequalities Report — United States 2013. MMWR Morb Mortal Wkly Rep 2013; 62(Suppl 3).
6. Institute of Medicine. The Hidden Epidemic: Confronting Sexually Transmitted Diseases. Washington, DC: National Academy Press; 1997.
7. Satterwhite CL, Torrone E, Meites E, et al. Sexually transmitted infections among US women and men: prevalence and incidence estimates, 2008. Sex Transm Dis 2013; 40(3):187–193.
8. Barnett JC, Vornovitsky MS. Current Population Reports, P60-257(RV), Health Insurance Coverage in the United States: 2015. Washington, DC: U.S. Government Printing Office; 2016.
9. Pérez-Escamilla R. Health care access among Latinos: Implications for social and health care reform. J Hispanic High Educ 2010: 9(1):43–60.
10. Berk ML, Schur CL. The effect of fear on access to care among undocumented Latino immigrants. J Immigr Health 2001; 3(3):151– 156.
11. Institute of Medicine. Unequal Treatment: Confronting Racial and Ethnic Disparities in Health Care. Washington, DC: National Academies Press; 2002.
12. Datta SD, Sternberg M, Johnson RE, et al. Gonorrhea and chlamydia in the United States among persons 14 to 39 years of age, 1999 to 2002. Ann Intern Med 2007; 147(2):89–96.
13. Miller WC, Ford CA, Morris M, et al. Prevalence of chlamydial and gonococcal infections among young adults in the United States. JAMA 2004; 291(18):2229–2236.
14. Office of Management and Budget. Provisional guidance on the implementation of the 1997 standards for federal data on race and ethnicity. Available at: https://www.whitehouse.gov/omb/fedreg_1997standards Accessed July 29, 2013.
- Page last reviewed: September 26, 2017
- Page last updated: September 26, 2017
- Content source: