

Figure S. Gonorrhea — Rate Ratios* by Race/Ethnicity, United States, 2012–2016
 ShareCompartir
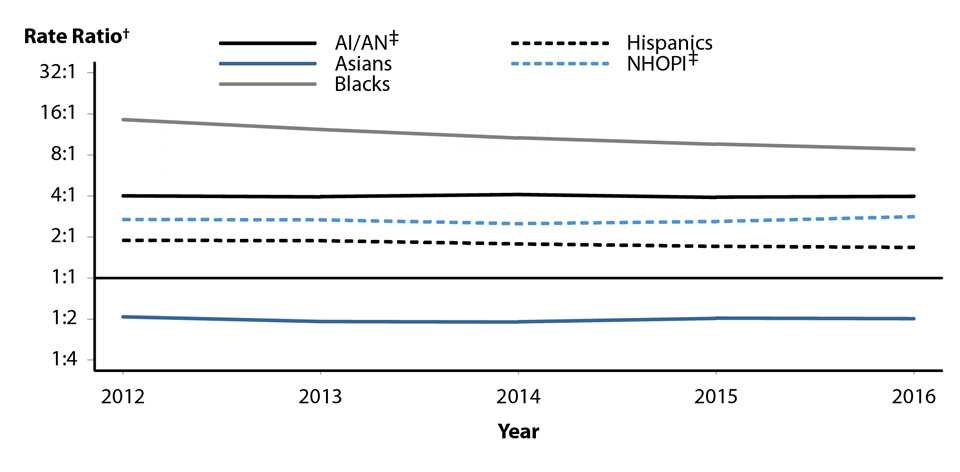
* Rate ratios are calculated as the rate of reported gonorrhea cases per 100,000 population for a given racial or ethnic minority population divided by the rate of reported gonorrhea cases per 100,000 population for Whites. Any population with a lower rate of reported cases of gonorrhea than the White population will have a rate ratio of less than 1:1.
† Y-axis is log scale.
‡ AI/AN = American Indians/Alaska Natives; NHOPI = Native Hawaiians/Other Pacific Islanders.
NOTE: Includes 46 states reporting race/ethnicity data in Office of Management and Budget compliant formats during 2012–2016 (see Section A1.5 in the Appendix).
- Page last reviewed: September 26, 2017
- Page last updated: September 26, 2017
- Content source: