

Figure T. Gonorrhea — Rates of Reported Cases by Race/Ethnicity and Sex, United States, 2016
 ShareCompartir
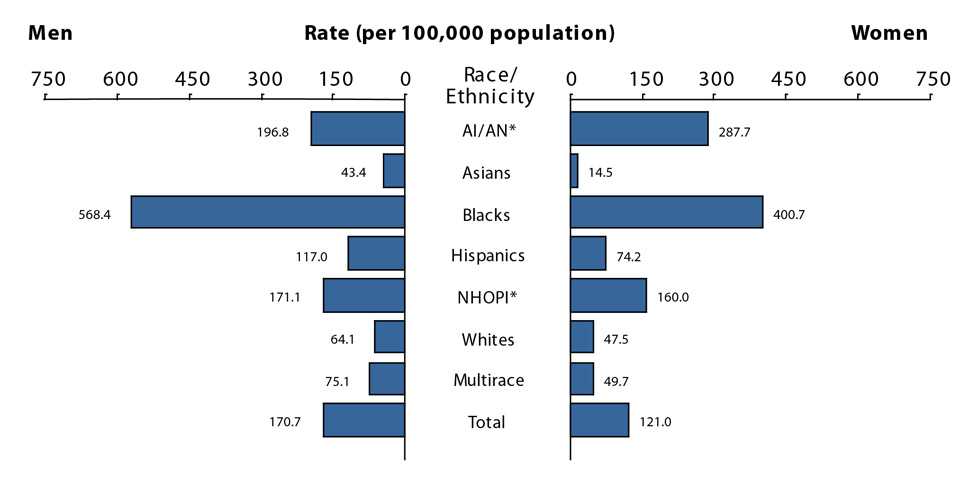
* AI/AN = American Indians/Alaska Natives; NHOPI = Native Hawaiians/Other Pacific Islanders.
NOTE: Includes 50 states and the District of Columbia reporting race/ethnicity data in Office of Management and Budget compliant formats in 2016 (see Section A1.5 in the Appendix).
Data provided in Table 22B.
- Page last reviewed: September 26, 2017
- Page last updated: September 26, 2017
- Content source: