

Syphilis
 ShareCompartir
Background
Syphilis, a genital ulcerative disease caused by the bacterium Treponema pallidum, is associated with significant complications if left untreated and can facilitate the transmission and acquisition of HIV infection.1–3 Additionally, historical data demonstrate that untreated early syphilis in pregnant women, if acquired during the four years before delivery, can lead to infection of the fetus in up to 80% of cases and may result in stillbirth or death of the infant in up to 40% of cases.4
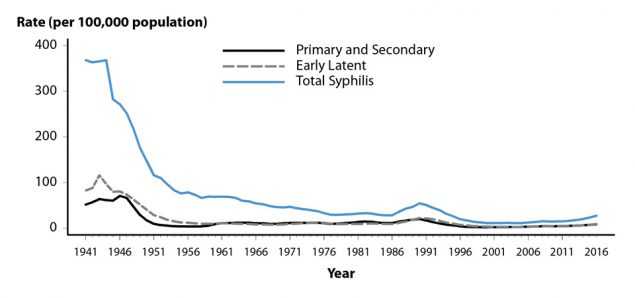
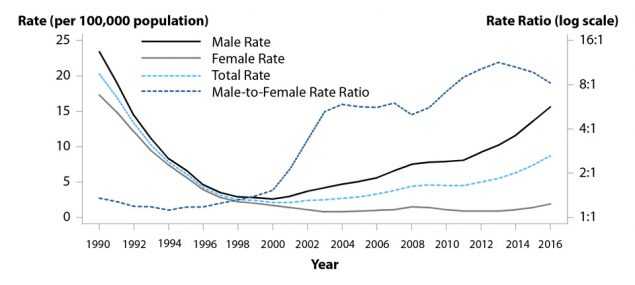
In 2000 and 2001, the national rate of reported primary and secondary (P&S) syphilis cases was 2.1 cases per 100,000 population, the lowest rate since reporting began in 1941 (Figure 30, Table 1). However, the P&S syphilis rate has increased almost every year since 2000–2001. In 2016, a total of 27,814 P&S syphilis cases were reported. During 2015–2016, the national P&S syphilis rate increased 17.6% to 8.7 cases per 100,000 population, the highest rate reported since 1993.
During 2000–2016, the rise in the rate of reported P&S syphilis was primarily attributable to increased cases among men and, specifically, among gay, bisexual, and other men who have sex with men (collectively
referred to as MSM) (Figures 34 and 35). However, during 2013–2016, the rate increased both among men and women (Tables 28 and 29). During 2015–2016, the rate increased 14.7% among men and 35.7% among women. These increases among women are of particular concern because congenital syphilis cases tend to increase as the rate of P&S syphilis among women increases (Figure 44). During 2015–2016, the national, male, and female P&S syphilis rates increased in every region of the country (Figure 31, Tables 27, 28, and 29). Nationally, P&S syphilis rates increased in every age group among those aged 15 years or older and in every race/ethnicity group during 2015–2016 (Figures 39 and 40, Table 34).
As in recent years, MSM accounted for the majority of reported P&S syphilis cases in 2016 (Figures 35 and 36). Nationally, the highest rates of P&S syphilis in 2016 were observed among men aged 20–34 years, among men in the West, and among Black men (Figure 37, Tables 29, 34 and 35B).
Interpreting Rates of Reported Cases of Syphilis
Left untreated, infection with syphilis can span decades. P&S syphilis are the earliest stages of infection, reflect symptomatic disease, and are indicators of incident infection.5 For these reasons, trend analyses of syphilis focus on reported cases and rates of reported cases of P&S syphilis. When referring to “P&S syphilis”, case counts are the sum of both primary and secondary cases, and “rate of P&S syphilis” refers to this sum per unit population.
Changes in reporting and screening practices can complicate interpretation of trends over time. To minimize the effect of changes in reporting over time, trend data in this report are restricted to jurisdictions that consistently report data of interest (e.g., sex of sex partner) for each year of a given time period. Details of these restrictions are provided in the text and footnotes of the pertinent text and figures.
P&S Syphilis — United States
In 2016, a total of 27,814 cases of P&S syphilis were reported in the United States, yielding a rate of 8.7 cases per 100,000 population (Figure 30, Table 1). This rate represents a 17.6% increase compared with 2015 (7.4 cases per 100,000 population), and a 74.0% increase compared with 2012 (5.0 cases per 100,000 population).
P&S Syphilis by Region
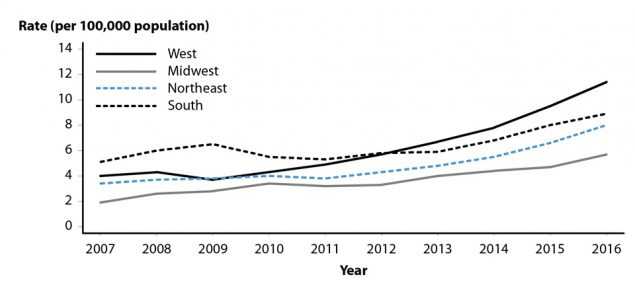
In 2016, the West had the highest rate of reported P&S syphilis cases (11.4 cases per 100,000 population), followed by the South (8.9 cases per 100,000 population), the Northeast (8.0 cases per 100,000 population), and the Midwest (5.7 cases per 100,000 population) (Table 27). During 2015–2016, the P&S syphilis rate increased in every region: 21.3% in the Midwest, 21.2% in the Northeast, 20.0% in the West, and 11.3% in the South (Figure 31, Table 27).
P&S Syphilis by State
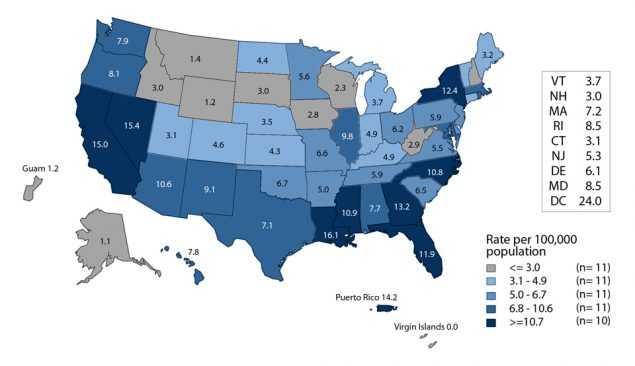
In 2016, rates of reported P&S syphilis cases per 100,000 population ranged by state from 1.1 in Alaska to 16.1 in Louisiana (Figure 32, Table 26). The rate of reported P&S syphilis cases in the District of Columbia was 24.0 cases per 100,000 population. During 2015–2016, P&S syphilis rates increased in 82.0% (41/50) of states and the District of Columbia, and remained stable or decreased in 18.0% (9/50) of states (Table 27).
P&S Syphilis by Metropolitan Statistical Area
The overall rate of reported P&S syphilis cases in the 50 most populous metropolitan statistical areas (MSAs) was 11.2 cases per 100,000 population in 2016, which represents a 14.3% increase since 2015 (9.8 cases per 100,000 population) (Table 30). Overall, in 2016, 71.3% of reported P&S syphilis cases (73.5% of male cases and 53.0% of female cases) were reported by these 50 MSAs. In 2016, the rate among women in these MSAs was 1.8 cases per 100,000 females, while the rate among men was 21.0 cases per 100,000 males (Tables 31 and 32).
P&S Syphilis by County
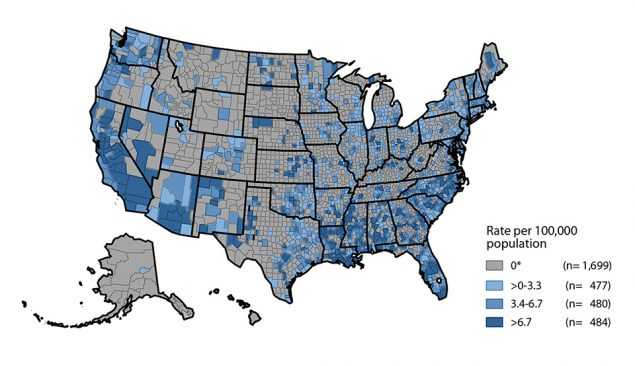
In 2016, 64.2% of reported P&S syphilis cases occurred in 70 counties or independent cities (Table 33). Of 3,140 counties in the United States, 484 (15.4%) had a P&S syphilis rate greater than 6.7 cases per 100,000 population, 480 (15.3%) reported a rate from 3.4 to 6.7 cases per 100,000 population, 477 (15.2%) reported a rate from 0.2 to 3.3 cases per 100,000 population, and 1,699 (54.1%) counties reported no cases of P&S syphilis in 2016 (Figure 33).
P&S Syphilis by Sex and Sexual Behavior
As has been observed in previous years, in 2016 the rate of reported P&S syphilis cases among men (15.6 cases per 100,000 males) was much higher than the rate among women (1.9 cases per 100,000 females), and men accounted for a large majority (88.9%) of P&S syphilis cases (Figure 36, Tables 28 and 29). Among men, the rate of P&S syphilis has increased every year since 2000, and during 2015–2016, the rate among men increased 14.7% (Figure 34, Table 29). In contrast, the P&S syphilis rate among women fluctuated between 0.8 and 1.7 cases per 100,000 females during 2000–2012, but has increased substantially since 2012 (Figure 34, Table 28). During 2012–2016, the P&S syphilis rate among women more than doubled (increased 111.1%). During 2015–2016, the P&S syphilis rate among women increased 35.7%.
These increases in male and female P&S syphilis rates were observed in every region of the country during 2015–2016. Among men, the rate increased 20.5% in the Northeast, 19.8% in the Midwest, 16.1% in the West, and 9.7% in the South (Table 29). Among women, the largest increases were observed in the West (58.8%), followed by the Northeast (28.6%), the South (22.2%) and the Midwest (20.0%) (Table 28).
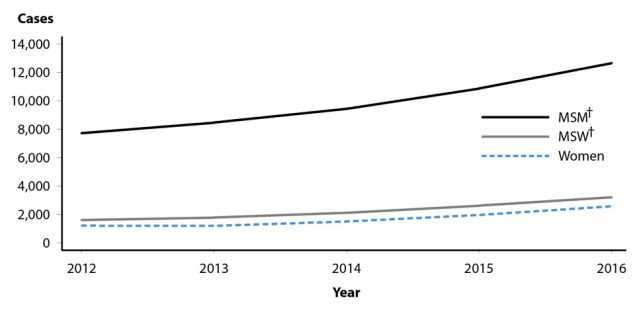
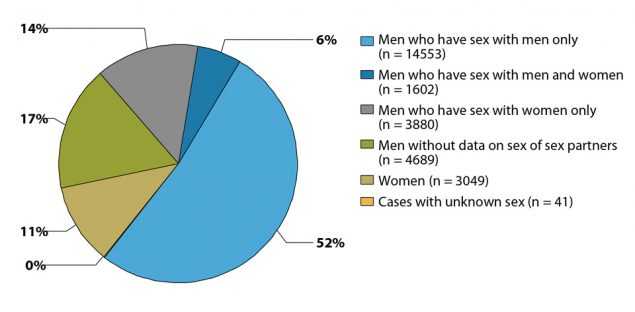
MSM continued to account for the majority of P&S syphilis cases in 2016 (Figures 35 and 36). Of 27,814 reported P&S syphilis cases in 2016, 16,155 (58.1%) were among MSM, including 14,553 (52.3%) cases among men who had sex with men only and 1,602 (5.8%) cases among men who had sex with both men and women (Figure 36). Overall, 3,880 (13.9%) cases were among men who had sex with women only (MSW), 3,049 (11.0%) were among women, 4,689 (16.9%) were among men without information about sex of sex partner, and 41 (0.1%) were cases reported with unknown sex. Among the 20,035 male cases with information on sex of sex partner, 80.6% occurred among MSM.
A total of 36 states were able to classify at least 70.0% of reported P&S syphilis cases as MSM, MSW, or women each year during 2012–2016 (Figure 35). In these states, during 2015–2016, the number of cases increased 16.4% among MSM, 22.2% among MSW, and 31.0% among women.
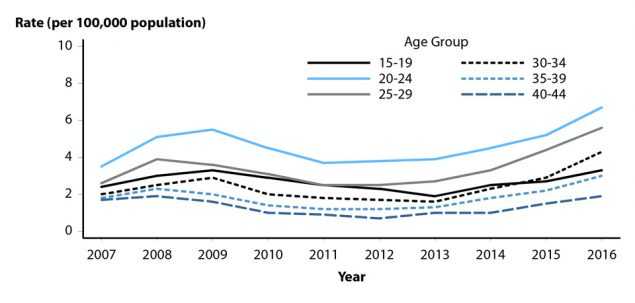
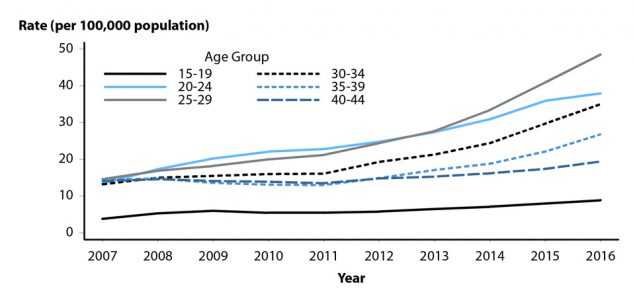
P&S Syphilis by Age
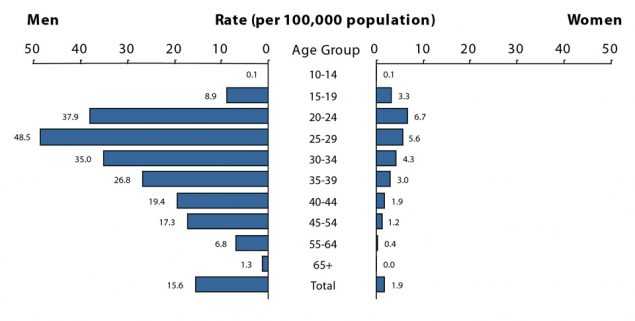
As in previous years, in 2016, rates of reported P&S syphilis cases were highest among persons aged 25–29 years and 20–24 years (Figure 37, Table 34). In 2016, the highest rates were observed among men aged 25–29 years (48.5 cases per 100,000 males), 20–24 years (37.9 cases per 100,000 males), and 30–34 years (35.0 cases per 100,000 males). The highest rates among women were among those aged 20–24 years (6.7 cases per 100,000 females) and those aged 25–29 years (5.6 cases per 100,000 females).
During 2015–2016, the overall rate of reported P&S syphilis cases increased in all age groups among those aged 15 years or older (Table 34). Rates increased 13.0% among those aged 15–19 years, 8.1% among those aged 20–24 years, 19.6% among those aged 25–29 years, 20.1% among those aged 30–34 years, 22.1% among those aged 35–39 years, 12.8% among those aged 40–44 years, 13.6% among those aged 45–54 years, 25.0% among those aged 55–64 years, and 50.0% among those aged 65 or older.
In 2016, persons aged 15–44 years accounted for 79.6% of reported P&S syphilis cases with known age. Among both men and women, the P&S syphilis rate increased during 2015–2016 in all age groups among those aged 15–44 years (Figures 38 and 39, Table 34).
P&S Syphilis by Race/Ethnicity
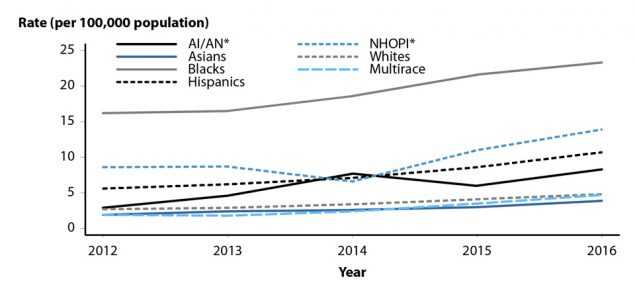
In 2016, all 50 states and the District of Columbia submitted data in the race and ethnicity categories according to the Office of Management and Budget (OMB) standards (see Section A1.5 in the Appendix). Among these, the rate of reported P&S syphilis cases was highest among Blacks (23.1 cases per 100,000 population) (Table 35B). The P&S syphilis rate among Blacks was 4.7 times the rate among Whites (4.9 cases per 100,000 population), the rate among Native Hawaiians/Other Pacific Islanders (12.9 cases per 100,000 population) was 2.6 times the rate among Whites, the rate among Hispanics (10.9 cases per 100,000 population) was 2.2 times the rate among Whites, the rate among American Indians/Alaska Natives (8.0 cases per 100,000 population) was 1.6 times the rate among Whites, and the rate among Asians (3.9 cases per 100,000 population) was 0.8 times the rate among Whites.
During 2012–2016, among the 46 states that submitted race and ethnicity data according to OMB standards (see Section A1.5 in the Appendix) for all five years during that period, the P&S syphilis rate increased among all race/ethnicity groups (Figure 40). Among these 46 states, the greatest increases during 2015–2016 were observed among those who identified as Multiracial (34.3%) and Asians (30.0%), followed by Native Hawaiians/Other Pacific Islanders (26.4%), Hispanics (24.4%), Whites (17.1%), and Blacks (7.9%).
More information on P&S syphilis rates among racial/ethnic groups can be found in the Special Focus Profiles.
P&S Syphilis and HIV Co-infection
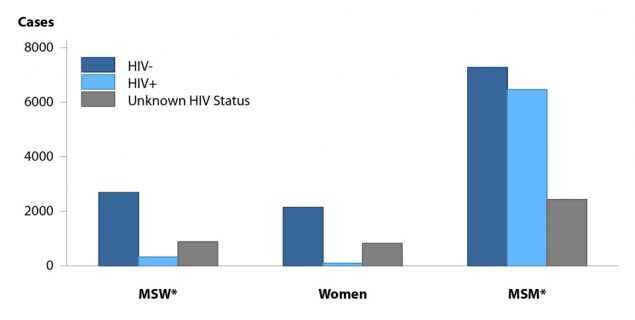
Reported cases of P&S syphilis continue to be characterized by a high rate of HIV co-infection, particularly among MSM (Figure 41). Among 2016 P&S syphilis cases with known HIV-status, 47.0% of cases among MSM were HIV-positive, compared with 10.7% of cases among MSW, and 4.1% of cases among women.
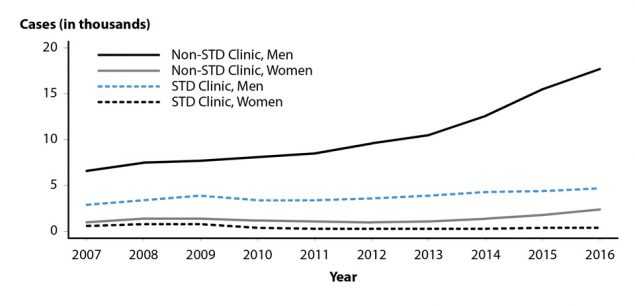
P&S Syphilis by Reporting Source
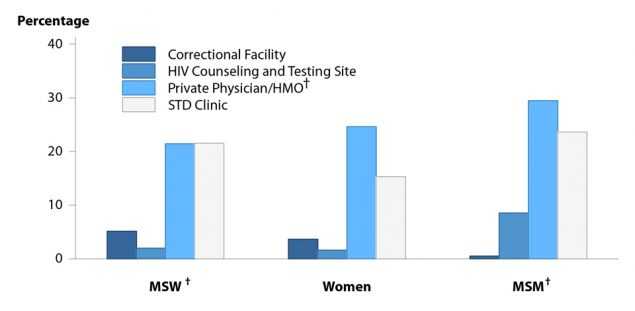
In 2016, 18.4% of P&S syphilis cases were reported from STD clinics, 72.1% were reported from venues outside of STD clinics, and 9.5% of cases had an unknown source of report (Table A2). During 2015–2016, the number of P&S syphilis cases reported by STD clinics and by non-STD clinic settings increased (Figure 42). However, the proportion of P&S syphilis cases that were reported by STD clinics has declined over the last decade from 30.3% of cases in 2007 to 18.4% of cases in 2016. In 2016, private physicians/health maintenance organizations (HMOs) and STD clinics were the most common reporting sources among MSM (29.5% and 23.6%, respectively), MSW (21.4% and 21.6%, respectively), and women (24.6% and 15.3%, respectively) (Figure 43).
Congenital Syphilis
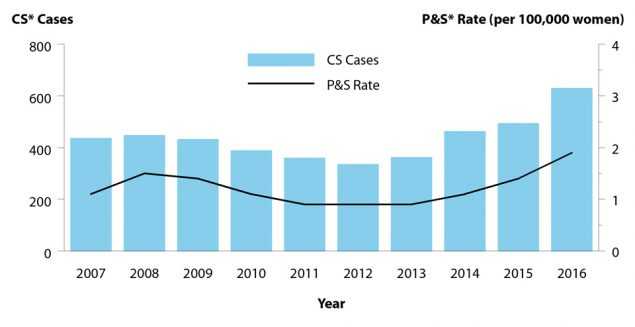
After decreasing from 10.5 to 8.4 reported congenital syphilis cases per 100,000 live births during 2008–2012, the rate of reported congenital syphilis has subsequently increased each year during 2012–2016 (Table 1). In 2016, there were a total of 628 reported cases of congenital syphilis, including 41 syphilitic stillbirths, and the national rate was 15.7 cases per 100,000 live births. This rate represents a 27.6% increase relative to 2015 (12.3 cases per 100,000 live births) and a 86.9% increase relative to 2012 (8.4 cases per 100,000 live births). As has been observed historically, these increases paralleled increases in P&S syphilis among women during 2015–2016 (35.7%) and during 2012–2016 (111.1%) (Figure 44, Table 28).
During 2012–2016, the increase in reported congenital syphilis cases was primarily attributable to an increase in the West. During this time period, the congenital syphilis rate increased 365.5% in the West, 100.0% in the Northeast, 29.9% in the South, and 23.5% in the Midwest (Table 41). During 2015–2016, the congenital syphilis rate increased 42.1% in the Northeast, 41.4% in the West, and 23.6% in the South, and did not change in the Midwest. In 2016, the highest congenital syphilis rates were reported from the West (25.6 cases per 100,000 live births), followed by the South (17.8 cases per 100,000 live births), Midwest (8.4 cases per 100,000 live births), and the Northeast (5.4 cases per 100,000 live births). In addition, rates were highest among Blacks (43.1 cases per 100,000 live births), followed by American Indians/Alaska Natives (31.6 cases per 100,000 live births), Hispanics (20.5 cases per 100,000 live births), Asians/Pacific Islanders (9.2 cases per 100,000 live births), and Whites (5.3 cases per 100,000 live births) (Table 42).
Syphilis — All Stages (P&S, Early Latent, Late, Late Latent, and Congenital)
In 2016, the total case count of reported syphilis (all stages combined: P&S, early latent, late, late latent, and congenital) was the highest recorded since 1993. The total number of cases of syphilis (all stages) reported to CDC increased 17.8% during 2015–2016 (from 74,707 cases to 88,042 cases) (Table 1). The number of cases of early latent syphilis reported to CDC increased 19.7% (from 24,173 cases to 28,924 cases), and the number of cases of late and late latent syphilis increased 17.2% (from 26,170 cases to 30,676 cases) (Tables 1, 36, and 38).
Syphilis among Special Populations
More information about syphilis and congenital syphilis in racial/ethnic groups, women of reproductive age, adolescents, and MSM can be found in the Special Focus Profiles.
Syphilis Summary
The national rate of reported P&S syphilis cases reached an historic low in 2000 and 2001, but has increased almost every year since then. This increase was largely attributable to an increase among men, and in particular among MSM. However, during 2015–2016, rates increased among both men and women in every region of the country. Rates of reported congenital syphilis cases also increased during 2015–2016. MSM continued to account for the majority of reported P&S syphilis cases in 2016. Nationally, the highest rates of P&S syphilis in 2016 were observed among men aged 20–34 years, among men in the West, and among Black men.
References
1. Jarzebowski W, Caumes E, Dupin N, et al. Effect of early syphilis infection on plasma viral load and CD4 cell count in human immunodeficiency virus- infected men: results from the FHDH- ANRS CO4 cohort. Arch Intern Med 2012; 172(16): 1237–1243.
2. Buchacz K, Patel P, Taylor M, et al. Syphilis increases HIV viral load and decreases CD4 cell counts in HIV-infected patients with new syphilis infections. AIDS 2004; 18(15): 2075–2079.
3. Fleming DT, Wasserheit JN. From epidemiological synergy to public health policy and practice: the contribution of other sexually transmitted diseases to sexual transmission of HIV infection. Sex Trans Infect 1999; 75(1): 3–17.
4. Ingraham NR. The value of penicillin alone in the prevention and treatment of congenital syphilis. Acta Derm Venereol 1951; 31(Suppl 24): 60–88.
5. Peterman TA, Kahn RH, Ciesielski CA, et al. Misclassification of the stages of syphilis: implications for surveillance. Sex Transm Dis 2005; 32(3):144–149.
- Page last reviewed: September 26, 2017
- Page last updated: September 26, 2017
- Content source: