

Figure 33. Primary and Secondary Syphilis — Rates of Reported Cases by County, United States, 2016
 ShareCompartir
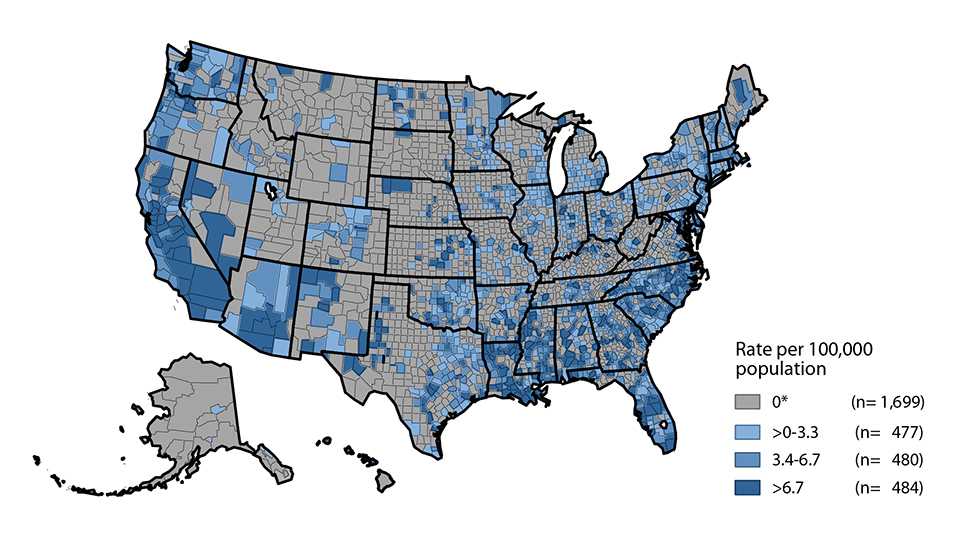
* In 2016, 1,699 (54.1%) of 3,140 counties in the United States reported no cases of primary and secondary syphilis. Refer to the NCHHSTP Atlas for further county-level rate information: https://www.cdc.gov/nchhstp/atlas/.
Data for top 70 counties and independent cities ranked by number of reported cases and then by rate provided in table 33.
NOTE: County was misclassified in the 2016 Alabama STD morbidity data resulting in inaccurate county-level case counts and rates.
- Page last reviewed: September 26, 2017
- Page last updated: September 26, 2017
- Content source: