Skip directly to search Skip directly to A to Z list Skip directly to page options Skip directly to site content

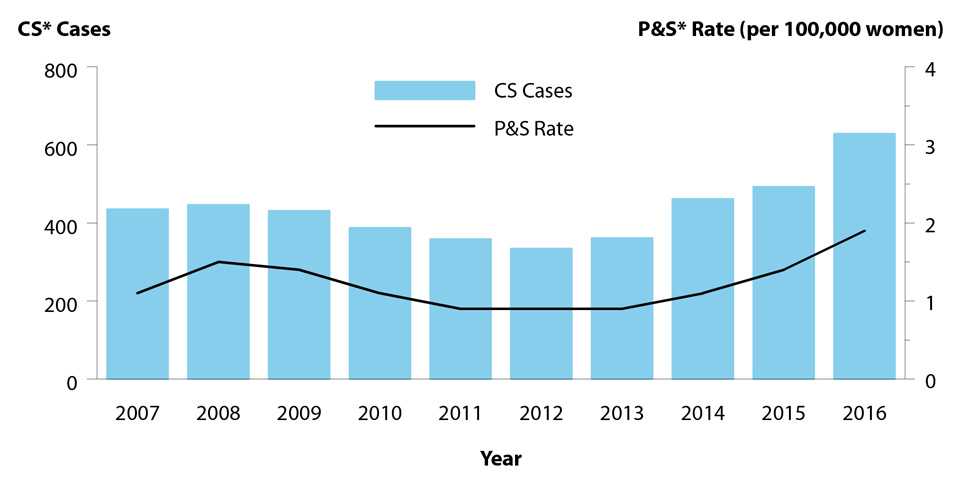
Figure 44. Congenital Syphilis — Reported Cases by Year of Birth and Rates of Reported Cases of Primary and Secondary Syphilis Among Women, United States, 2007–2016

Figure 44. Bar graph showing reported cases of congenital syphilis by year of birth and rates of reported cases of primary and secondary syphilis among women in the United States from 2007 to 2016. Data for congenital syphilis cases from 2007 to 2016 provided in table 1 and for primary and secondary syphilis among women from 2012 to 2016 provided in table 31.

* CS = Congenital syphilis; P&S = Primary and secondary syphilis.

Data for congenital syphilis cases from 2007 to 2016 provided in table 1 and for primary and secondary syphilis among women from 2012 to 2016 provided in table 31.

Next

TOP