Skip directly to search Skip directly to A to Z list Skip directly to page options Skip directly to site content

Figure 32. Primary and Secondary Syphilis — Rates of Reported Cases by State, United States and Outlying Areas, 2016

Figure 32. United States map showing rates of reported cases of primary and secondary syphilis in 2016 by state and outlying Areas (Guam, Puerto Rico, and Virgin Islands). Data provided in table 27.

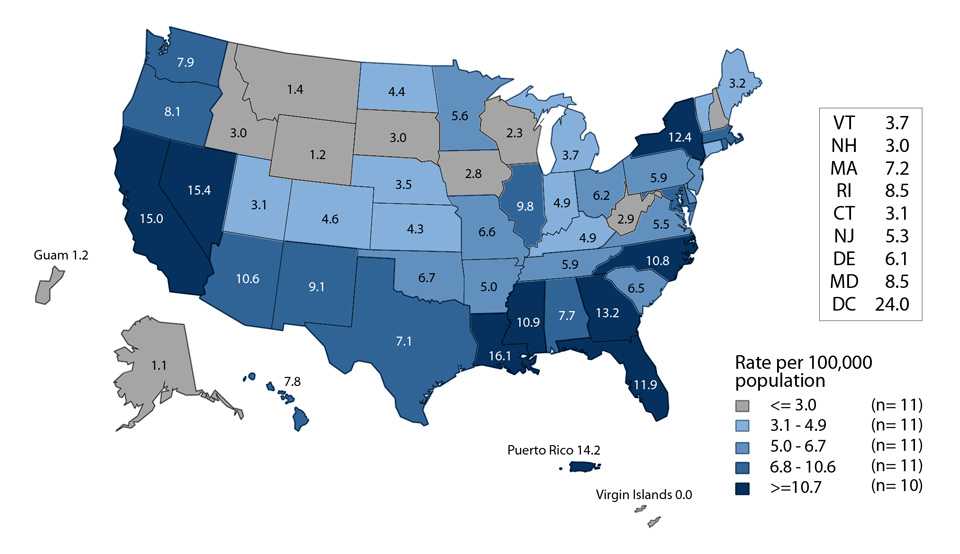
NOTE: The total rate of reported cases of primary and secondary syphilis for the United States and outlying areas (Guam, Puerto Rico, and Virgin Islands) was 8.7 per 100,000 population.

Data provided in table 27.

Next

TOP