

Figure 35. Primary and Secondary Syphilis — Reported Cases by Sex and Sexual Behavior, 36 States*, 2012–2016
 ShareCompartir
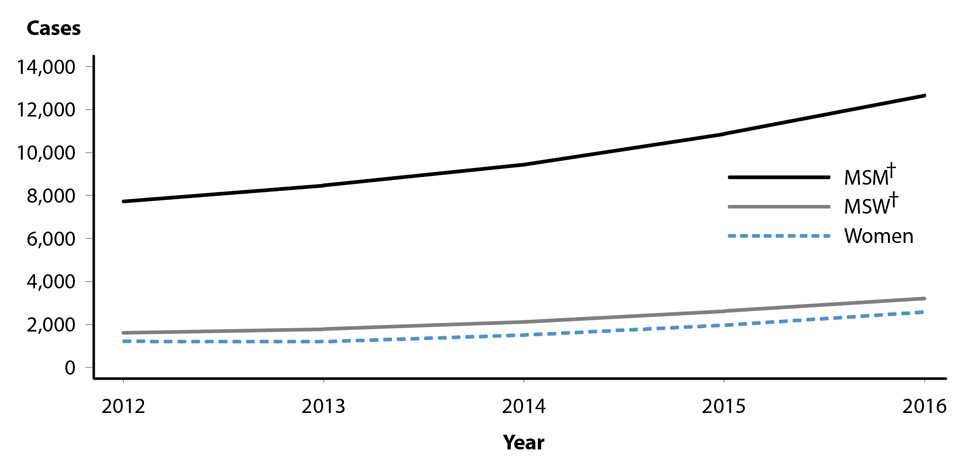
* 36 states were able to classify ≥70% of reported cases of primary and secondary syphilis as either MSM†, MSW†, or women for each year during 2012–2016.
† MSM = Gay, bisexual, and other men who have sex with men (collectively referred to as MSM); MSW = Men who have sex with women only.
- Page last reviewed: September 26, 2017
- Page last updated: September 26, 2017
- Content source: