

Figure W. Congenital Syphilis — Rates of Reported Cases by Year of Birth and Race/Ethnicity of Mother, United States, 2007–2016
 ShareCompartir
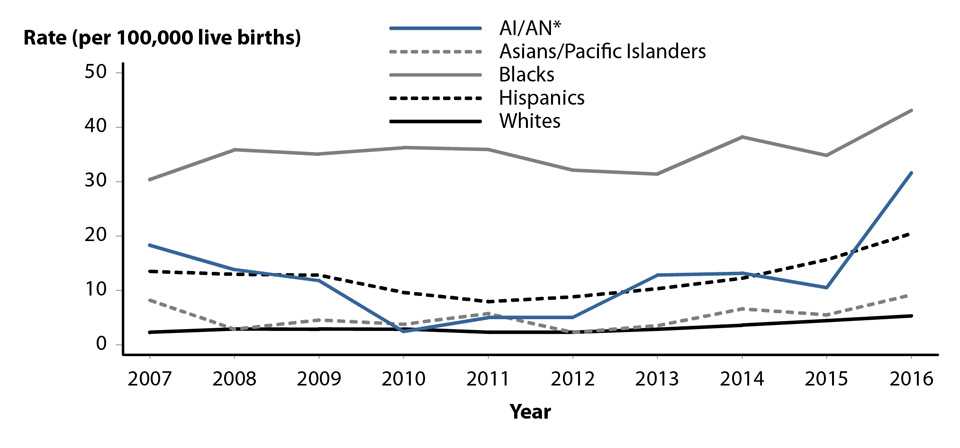
* AI/AN = American Indians/Alaska Natives.
NOTE: National Center for Health Statistics bridged race categories are presented to allow the display of data across several years.
Data for 2012 to 2016 provided in table 42.
- Page last reviewed: September 26, 2017
- Page last updated: September 26, 2017
- Content source: