

Figure 8. Chlamydia — Percentage of Reported Cases Among Women by Reporting Source*, United States, 2007–2016
 ShareCompartir
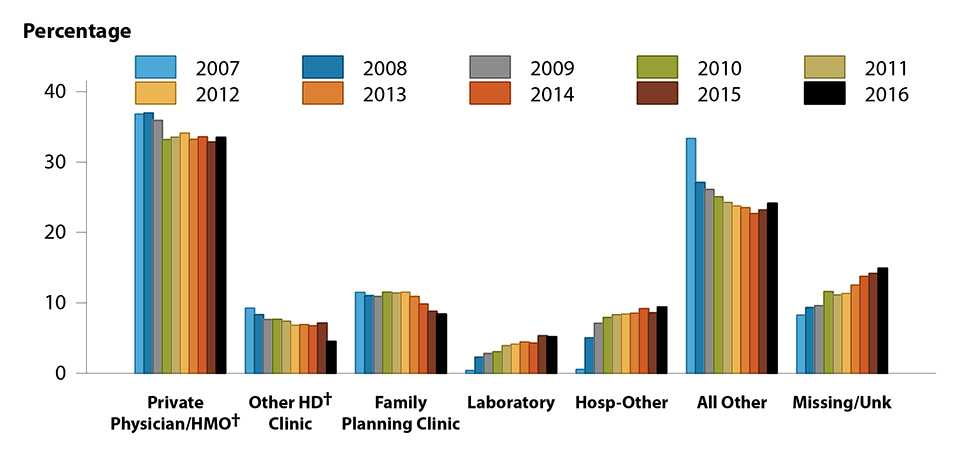
* Includes the top five reporting sources for chlamydia cases reported among women, plus those with reporting sources listed as “All Other” and “Missing/Unknown”.
† HMO = health maintenance organization; HD = health department.
NOTE: All Other includes: Drug Treatment, Tuberculosis Clinic, Correctional Facility, Blood Bank, Labor and Delivery, Prenatal Care, National Job Training Program, School-based Clinic, Mental Health Provider, Indian Health Service, Military, Emergency Room, STD Clinic, HIV Counseling and Testing Site, and Other.
- Page last reviewed: September 26, 2017
- Page last updated: September 26, 2017
- Content source: