

Figure 4. Chlamydia — Rates of Reported Cases by County, United States, 2016
 ShareCompartir
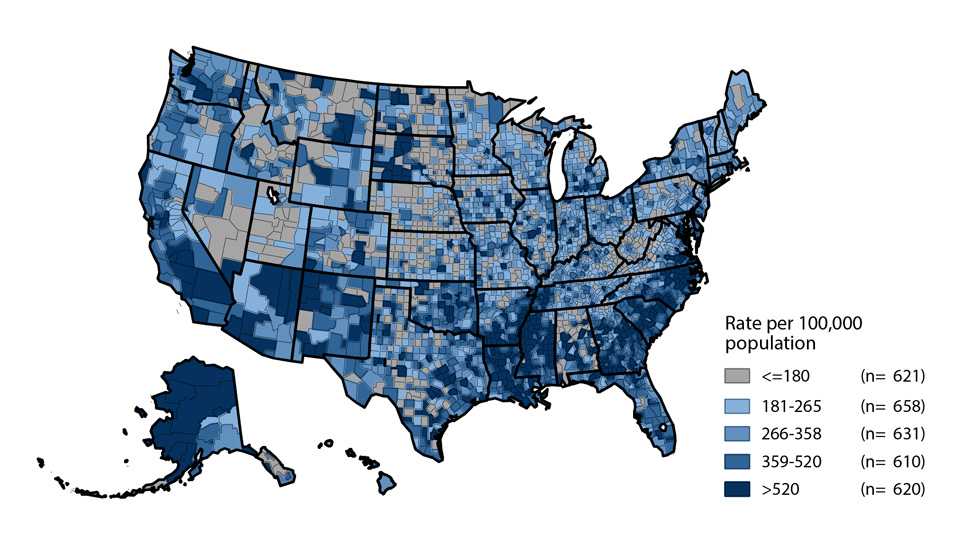
NOTE: Refer to the NCHHSTP Atlas for further county-level rate information: https://www.cdc.gov/nchhstp/atlas .
Data for top 70 counties and independent cities ranked by number of reported cases and then by rate provided in table 9.
County was misclassified in the 2016 Alabama STD morbidity data resulting in inaccurate county-level case counts and rates.
- Page last reviewed: September 26, 2017
- Page last updated: September 26, 2017
- Content source: