

Figure 23. Estimated Proportion* of MSM-Only†, MSMW†, MSW†, and Women Among Gonorrhea Cases by Jurisdiction, STD Surveillance Network (SSuN), 2016
 ShareCompartir
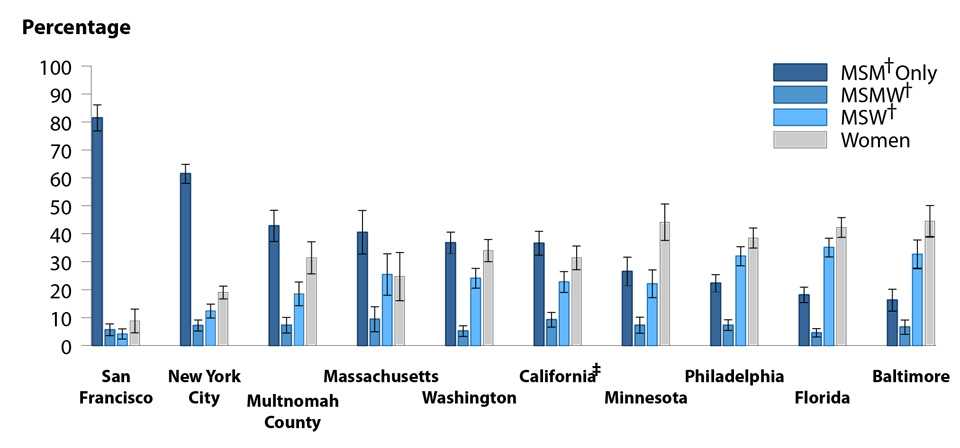
* Estimate based on weighted analysis of data obtained from interviews (n=5,177) conducted among a random sample of reported gonorrhea cases during January to December 2016.
† MSM-Only = Men who have sex exclusively with men; MSMW = Men who have sex with both men and women; MSW = Men who have sex with women only.
‡ California data excludes San Francisco (shown separately).
NOTE: See section A2.2 in the Appendix for SSuN methods.
Data from the STD Surveillance Network (SSuN). The data represented in this figure can be downloaded at www.cdc.gov/std/stats16/figures/OtherFigureData.zip.
- Page last reviewed: September 26, 2017
- Page last updated: September 26, 2017
- Content source: