

Figure 24. Gonorrhea — Proportion* of STD Clinic Patients Testing Positive† by Age Group, Sex, and Sexual Behavior, STD Surveillance Network (SSuN), 2016
 ShareCompartir
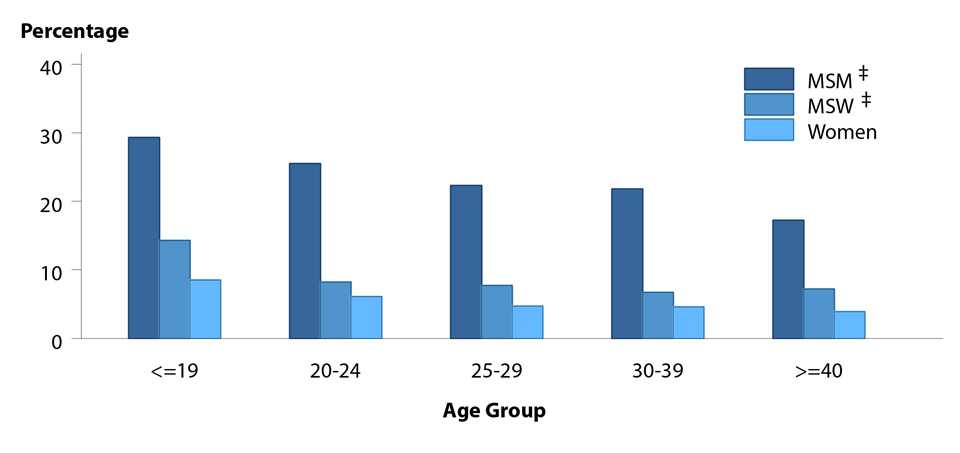
* Proportions represent the overall average of the mean value by jurisdiction.
† Results are based on data obtained from patients with known sexual behavior (n=75,347) attending SSuN STD clinics in 2016 in all SSuN jurisdictions, excluding Florida.
‡ MSM = Gay, bisexual, and other men who have sex with men (collectively referred to as MSM); MSW = Men who have sex with women only.
NOTE: See section A2.2 in the Appendix for SSuN methods.
Data from the STD Surveillance Network (SSuN). The data represented in this figure can be downloaded at www.cdc.gov/std/stats16/figures/OtherFigureData.zip
- Page last reviewed: September 26, 2017
- Page last updated: September 26, 2017
- Content source: