

Figure 28. Neisseria gonorrhoeae — Distribution of Isolates with Penicillin, Tetracycline, and/or Ciprofloxacin Resistance, Gonococcal Isolate Surveillance Project (GISP), 2016
 ShareCompartir
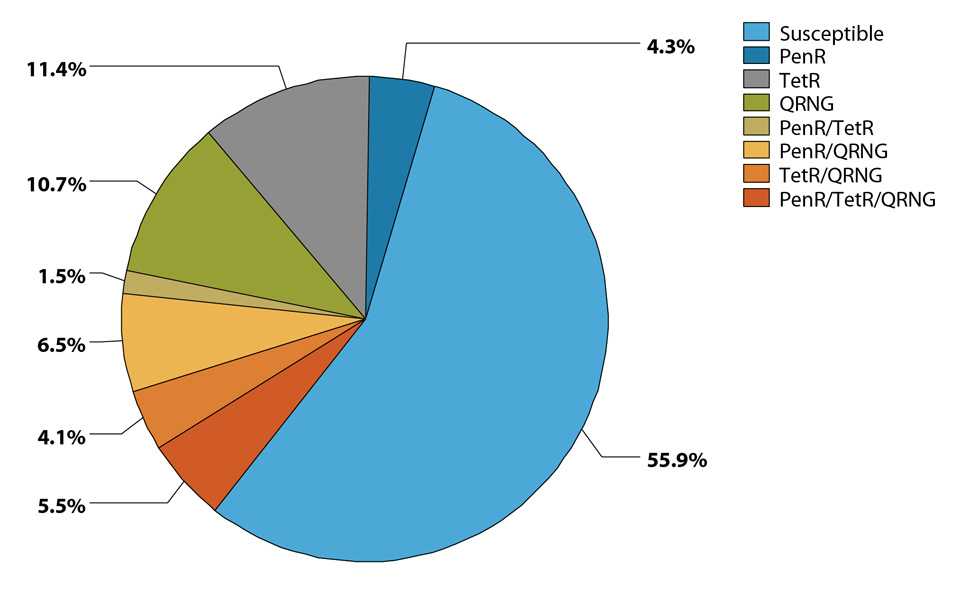
NOTE: PenR = penicillinase-producing Neisseria gonorrhoeae and chromosomally-mediated penicillin-resistant N. gonorrhoeae; TetR = chromosomally- and plasmid-mediated tetracycline-resistant N. gonorrhoeae; and QRNG = quinolone-resistant N. gonorrhoeae.
The data represented in this figure can be downloaded at www.cdc.gov/std/stats16/figures/OtherFigureData.zip.
- Page last reviewed: September 26, 2017
- Page last updated: September 26, 2017
- Content source: