

Figure 22. Gonorrhea — Percentage of Reported Cases Among Women by Reporting Source*, United States, 2007–2016
 ShareCompartir
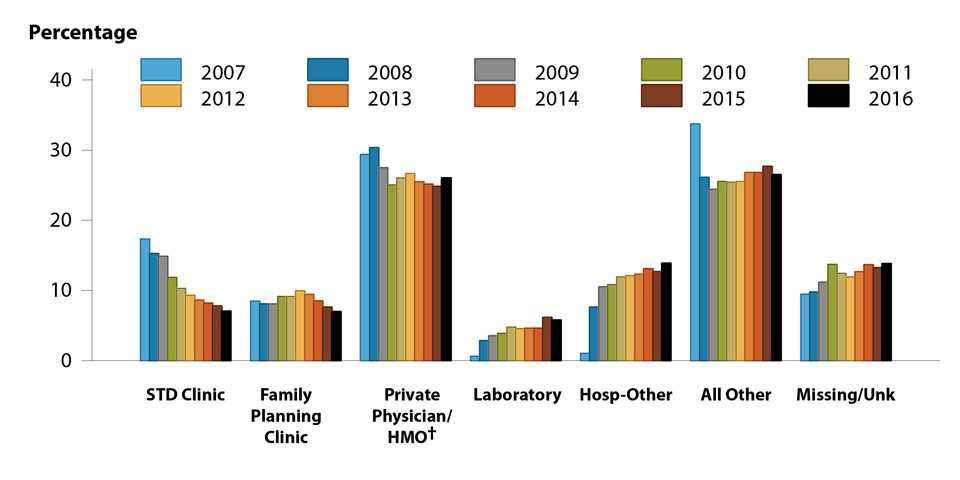
* Includes the top five reporting sources for gonorrhea cases reported among women, plus those with reporting sources listed as “All Other” and “Missing/Unknown”.
† HMO = health maintenance organization.
NOTE: All Other includes: Drug Treatment, Tuberculosis Clinic, Correctional Facility, Blood Bank, Labor and Delivery, Prenatal Care, National Job Training Program, School-based Clinic, Mental Health Provider, Indian Health Service, Military, Emergency Room, Other Health Department Clinic, HIV Counseling and Testing Site, and Other.
The data represented in this figure can be downloaded at www.cdc.gov/std/stats16/figures/OtherFigureData.zip.
- Page last reviewed: September 26, 2017
- Page last updated: September 26, 2017
- Content source: