

Figure 27. Neisseria gonorrhoeae — Distribution of Azithromycin Minimum Inhibitory Concentrations (MICs) by Year, Gonococcal Isolate Surveillance Project (GISP), 2012–2016
 ShareCompartir
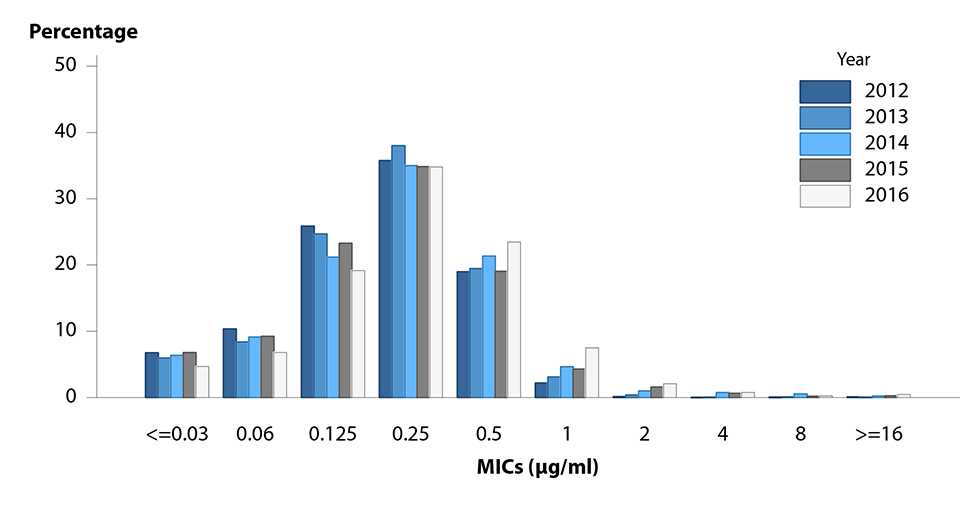
The data represented in this figure can be downloaded at www.cdc.gov/std/stats16/figures/OtherFigureData.zip
- Page last reviewed: September 26, 2017
- Page last updated: September 26, 2017
- Content source: