

Figure 26. Neisseria gonorrhoeae — Percentage of Isolates with Elevated Ceftriaxone Minimum Inhibitory Concentrations (MICs) (≥0.125 µg/ml) and Elevated Cefixime MICs (≥0.25 µg/ml), Gonococcal Isolate Surveillance Project (GISP), 2006–2016
 ShareCompartir
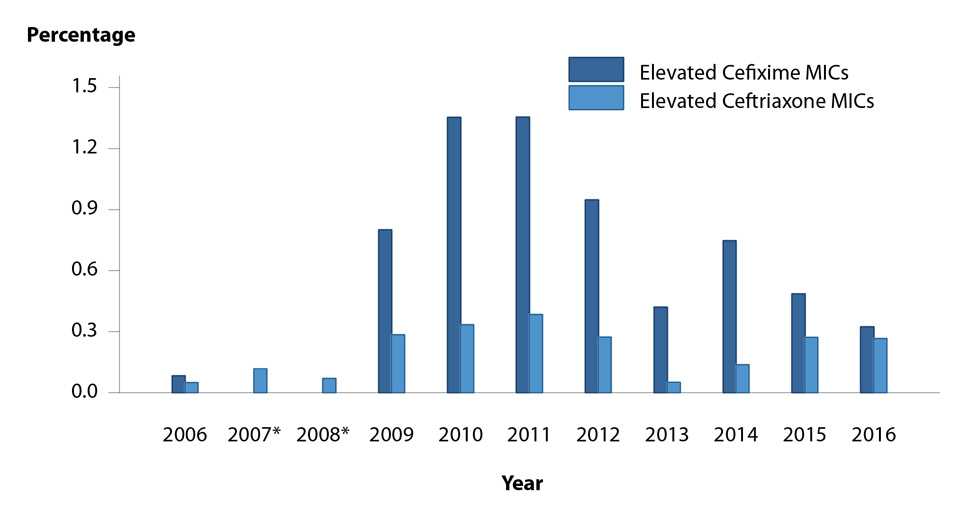
* Isolates not tested for cefixime susceptibility in 2007 and 2008.
Data from the Gonococcal Isolate Surveillance Project (GISP). The data represented in this figure can be downloaded at www.cdc.gov/std/stats16/figures/OtherFigureData.zip.
- Page last reviewed: September 26, 2017
- Page last updated: September 26, 2017
- Content source: