

Year One Findings
 ShareCompartir
Findings from the first year of ECHPP are based on information summarized in the Year 1 ECHPP Monitoring and Evaluation Report. The Year 1 Report contains aggregate, quantitative and qualitative programmatic data reported to CDC by ECHPP health department grantees through Workbook #3 and the Core Process Data Report for the Oct. 2010 to Sept. 2011 time period.
Progress Toward Local ECHPP Program Objectives
Grantees implemented different combinations of activities with various degrees of scale to address local jurisdiction HIV prevention needs. Grantees also developed local program objectives for each year of their ECHPP plan which varied widely across jurisdictions. For example, some grantees identified a large number of planning objectives (e.g., finalize a protocol for provision of PEP, convene a PCSI workgroup) and few objectives related to actual implementation (e.g., distribute 1 million condoms to venues that target HIV-positive persons and persons at high risk for HIV infection, provide medical case management with treatment adherence counseling to 5,000 people with HIV). Other grantees had a more evenly distributed mix of planning and implementation objectives. Also, some objectives were broad in scope while others were more focused. Some jurisdictions needed more time to scale up a specific intervention (e.g., if they had not previously implemented the intervention); therefore, more planning was needed during the first year to determine the optimal level of implementation. Most of the objectives were specific to Year 1 activities only, although some objectives extended into Year 2 (new local objectives are added annually by grantees).
Monitoring grantee progress toward local ECHPP program objectives over time will provide insight into the extent to which programs were implemented as intended (when used in conjunction with other information reported in routine progress reports). For example, ECHPP may not have the anticipated level of impact in some areas if there is weak and/or delayed implementation of specific programs.
Figure 1 shows the overall progress made by grantees toward their local objectives in Year 1 by ECHPP intervention category, which is based on the percentage of objectives for which grantees report being on or ahead of schedule. For example, 117 total objectives were specified for HIV testing; across grantees, 77 of these objectives (66%) were on or ahead of schedule in Year 1. The total number and range of objectives specified for an intervention category across grantees is displayed on the right side of the graph.
Figure 1. Overall Progress Toward Local ECHPP Program Objectives
12 ECHPP MSAs, Oct. 2010 to Sept. 2011
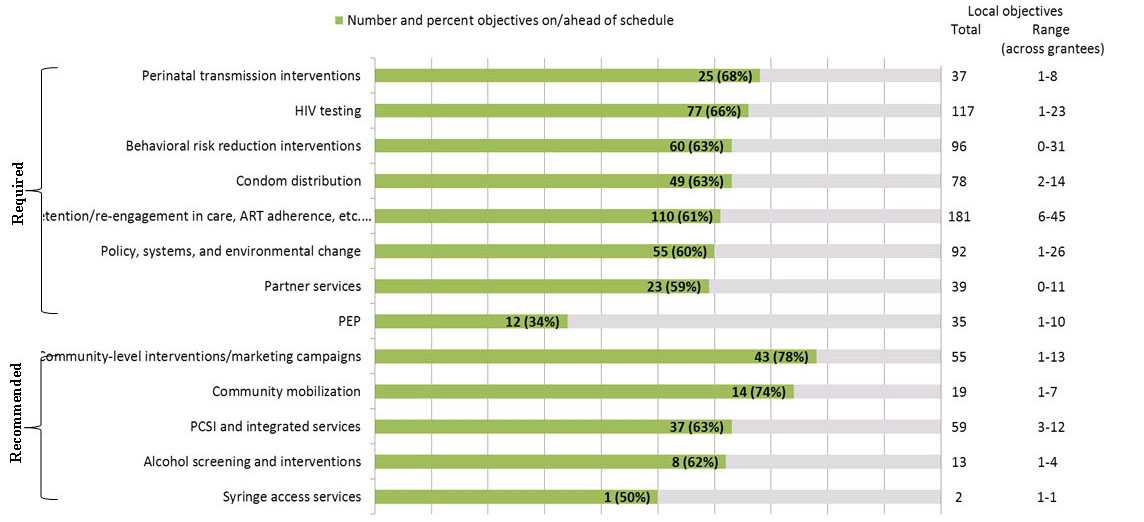
Data source: ECHPP Workbook #3
Note: Graph includes all Year 1 local objectives for all grantees. Objectives associated with ongoing activities (where no target date was specified) are also included. Similar objectives may have been identified by more than one grantee within a specific intervention category. Number of grantees that implemented the recommended activities: community-level interventions=9; social marketing campaigns=11; community mobilization activities=8; PCSI and integrated services=9; alcohol screening and interventions=6; syringe access services=6.
The data in Figure 1 suggest that progress made toward scale-up of HIV-related activities during the first year of ECHPP was similar across most intervention categories. However, some activities may have been harder to scale up than others. For example, only moderate progress was made toward achieving PEP-related objectives, perhaps because PEP is relatively new to most health departments and they have only recently begun to conduct relevant planning and implementation activities. Figure 1 also illustrates a significant shift in programmatic services due to the ECHPP model and the National HIV/AIDS Strategy. The 2015 Strategy objectives are ambitious and, as a result, ECHPP grantees set ambitious local objectives in Year 1 in order to meet the 2015 targets. It should also be noted that ECHPP grantees spent the first part of Year 1 developing their ECHPP plan and these data represent an initial implementation phase that was less than a full year.
Health departments planning to scale up their HIV activities to address National HIV/AIDS Strategy goals and objectives should allow ample time for planning and implementation. Furthermore, local program objectives should be realistic and achievable.
Grantee Reporting of Core Process Data
Early in Year 1, CDC evaluation staff supported conference calls with jurisdictions to assess reporting capacity for a variety of process measures. The final process measures, considered to be the "core" ECHPP process measures, were deemed reportable by most jurisdictions and will be used by CDC to compute key indicators. Grantees are required to report these core process measures throughout the project period (once for Year 1; semi-annually for Years 2 and 3). ECHPP plans should represent all HIV prevention, care, and treatment activities supported by health departments, regardless of funding source (e.g., publicly funded services such as those funded by CDC and other federal agencies; privately funded programs such as grants and foundation dollars). Thus, where feasible, grantees are to report the core process measures regardless of funding sources (public or private).
The availability of data for Year 1 interventions varied across jurisdictions. Reasons for not reporting data include grantee had not previously implemented the activity, grantee had not previously monitored the activity, or grantee had not yet made appropriate partnerships or other structural changes to facilitate data sharing and reporting. Thus, the data reported here may not be representative of all programs and activities conducted across jurisdictions in Year 1.
Table 1 lists the number of jurisdictions that implemented each intervention category in Year 1 and the number that reported core process data for each category.
Table 1. Number of ECHPP Grantees Implementing Each Intervention and Number of Grantees Reporting Core Process Data
Oct. 2010 to Sept. 2011
| Intervention | Required or recommended intervention? | No. of jurisdictions that implemented the intervention in Year 1 | No. of jurisdictions that reported core process data for the intervention in Year 1 |
|---|---|---|---|
| Perinatal transmission interventions | Required | 12 | N/Aa |
| HIV testing | Required | 12 | 12 |
| Behavioral risk reduction interventions (for HIV-positive individuals) | Required | 12 | 10 |
| Condom distribution (targeted to HIV-positive and high-risk, HIV-negative/HIV-unknown individuals) | Required | 12 | 11 |
| Retention, re-engagement in care, ART adherence, STD screening for HIV-positive individuals | Required | 12 | 10 |
| Policy, systems, and environmental change | Required | 12 | N/Aa |
| Partner servicesc | Required | 12 | 12 |
| PEP | Required | 3b | 3 |
| Community-level interventions | Recommended | 9 | 8 |
| Social marketing campaigns | Recommended | 11 | 10 |
| Community mobilization | Recommended | 8 | N/Aa |
| PCSI and integrated services | Recommended | 9 | N/Aa |
| Alcohol screening and interventions | Recommended | 6 | N/Aa |
| Syringe access servicesc | Recommended | 6 | 6 |
| Condom distribution (targeted to general population) | Recommended | 9 | 7 |
| Behavioral risk reduction interventions (clinic- or provider-delivered; interventions for high-risk, HIV-negative/HIV-unknown individuals) | Recommended | 12 | 10 |
| Behavioral risk reduction interventions (for high-risk, HIV-negative/HIV-unknown individuals) | Recommended | 12 | 10 |
a Grantees were not required to report core process measures for this intervention category.
b Although only three grantees began implementing PEP in Year 1, all grantees conducted planning activities for PEP.
c Although federal funding can no longer be used to support syringe access services, six grantees were able to provide information about syringe access programs they support funded from other sources for the purposes of evaluating ECHPP.
Key process indicators
Key process indicators for Year 1 are summarized below (computed from process data submitted by grantees). Data were reported in aggregate, were not de-duplicated for persons participating in more than one intervention or program, and represent all programs and services in the jurisdiction supported by the health department whether publicly or privately funded for which information was available. HIV status for health department clients may be self-report or confirmed through HIV testing in each jurisdiction. Community-based organization activities implemented with direct funds from CDC in these jurisdictions are not included.
CDC evaluation team staff communicated with each ECHPP grantee directly (via phone calls and e-mails) to ensure that CDC had a clear understanding of all programmatic data submitted and that the information was appropriately matched to Workbook #3. However, no specific quality assurance procedures were conducted beyond that which was conducted by the health departments. These data are complete to the extent that grantees were able to collect and report programmatic data for each ECHPP intervention. CDC provided grantees with definitions for each measure and guidance for how to report the information. To provide context for the findings, the number of people living with a diagnosis of HIV infection (HIV prevalence) and the number of diagnoses (cases) of HIV infection in these jurisdictions are included in select graphs (using the most recent HIV surveillance data available). The estimated number of individuals in need of ECHPP services and programs was not available.
Behavioral risk reduction interventions
In Year 1, 123,216 individuals participated in one or more behavioral risk reduction interventions.
Nine grantees were able to report these data stratified by HIV status, transmission risk group, and race/ethnicity. In these jurisdictions, 27,192 participants in behavioral risk reduction interventions were HIV-positive; 36,091 were MSM; 29,366 were African American; and 19,649 were Hispanic/Latino.
Figure 2. Participation in Behavioral Risk Reduction Interventions
12 ECHPP MSAs, October 2010 to September 2011
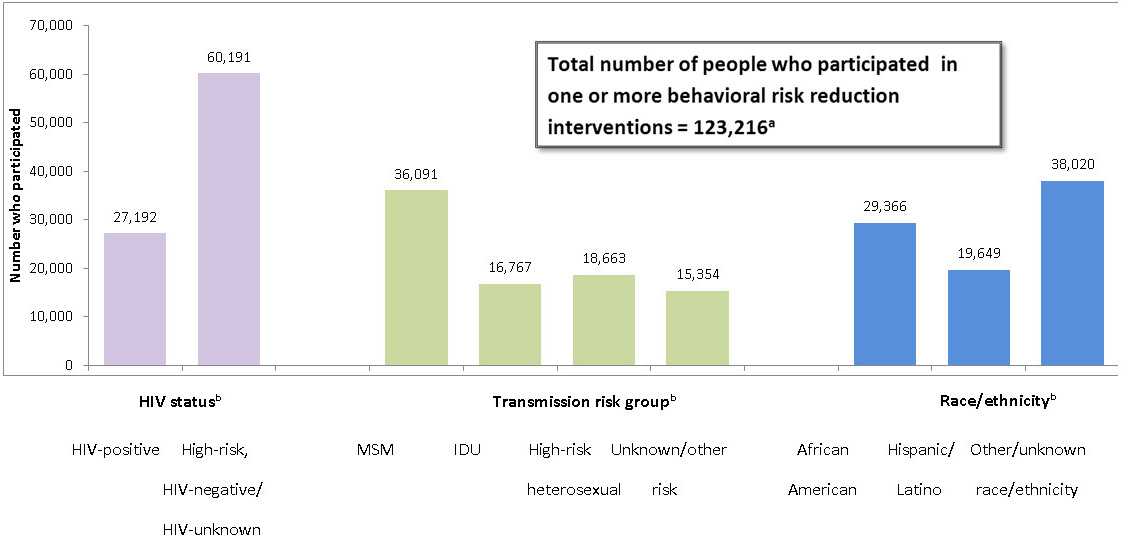
aAll 12 grantees reported the number of people who participated in behavioral risk reduction interventions.
bOnly 9 grantees reported these data stratified by HIV status, transmission risk group, and race/ethnicity. Thus, numbers will not total to 100% of all who participated. Other/unknown race/ethnicity includes whites.
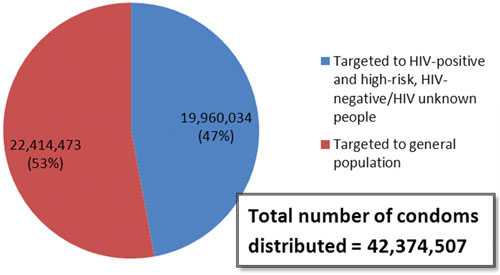
Condom distribution
In Year 1, a total of 42,374,507 condoms were distributed. Over half (53%) were distributed targeting HIV-positive or high-risk, HIV-negative/HIV-unknown individuals and the remaining (47%) were distributed to the general population.
Figure 3. Condom Distribution
12 ECHPP MSAs, October 2010 to September 2011
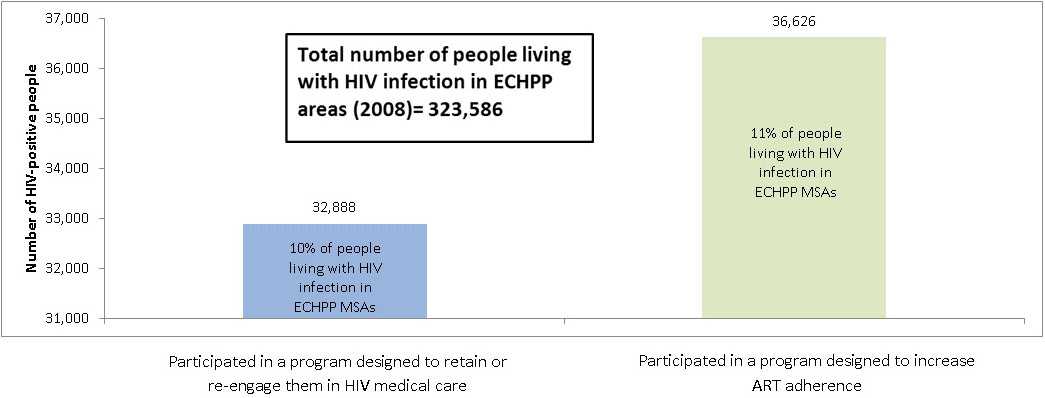
Retention, Re-engagement in Care, and ART Adherence for HIV-positive Individuals
In Year 1, 32,888 HIV-positive individuals participated in a program designed to retain or re-engage them in HIV medical care and 36,626 HIV-positive individuals participated in an ART adherence program, representing an estimated 10% and 11%, respectively, of people living with HIV in the 12 MSAs in 2008.
Figure 4. Participation in Retention or Re-engagement in Care Programs and Participation in ART Adherence Programs (HIV-positive Individuals)
12 ECHPP MSAs, October 2010 to September 2011
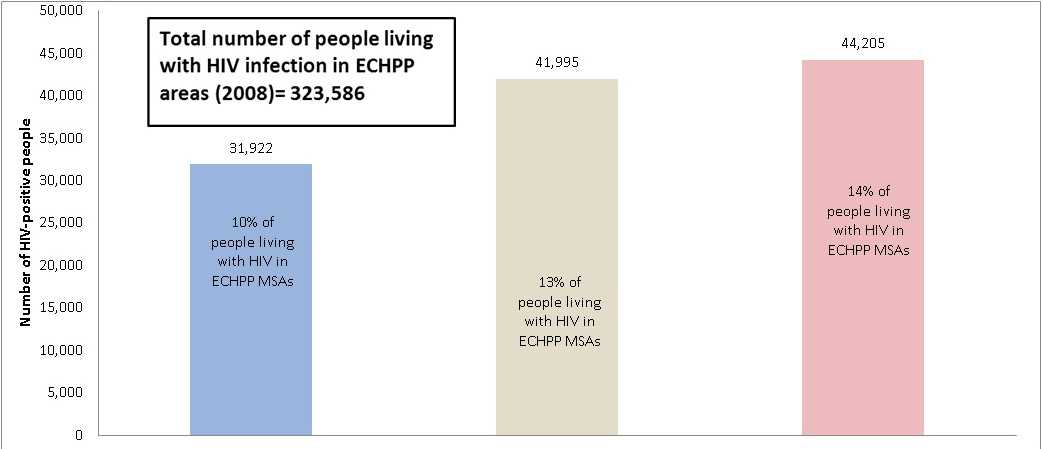
STD Screening for HIV-positive Individuals
In Year 1, 31,922 HIV-positive individuals were screened for chlamydia, 41,995 were screened for gonorrhea, and 44,205 were screened for syphilis, representing an estimated 10%, 13%, and 14%, respectively, of people living with HIV in ECHPP MSAs in 2008.
Figure 5. STD Screening Among HIV-positive Individuals
12 ECHPP MSAs, October 2010 to September 2011
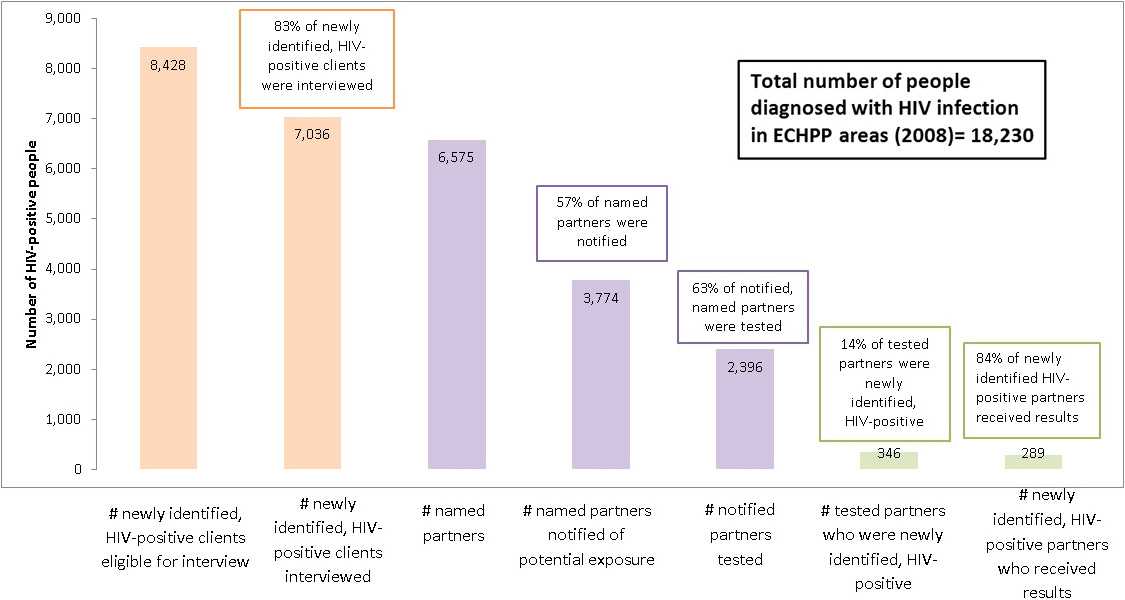
Partner Services
In Year 1, among the 8,428 newly identified, HIV-positive clients who were eligible to be interviewed for partner services in the ECHPP MSAs, 83% were interviewed (7,036). Of the 6,575 named partners, 57% were notified of potential HIV exposure (3,774). Sixty-three percent of named partners who were notified were tested for HIV and 84% of newly identified HIV-positive partners received their test results. Of partners who were tested, 14% were newly identified as HIV-positive.
Figure 6. Participation in Partner Services
12 ECHPP MSAs, October 2010 to September 2011
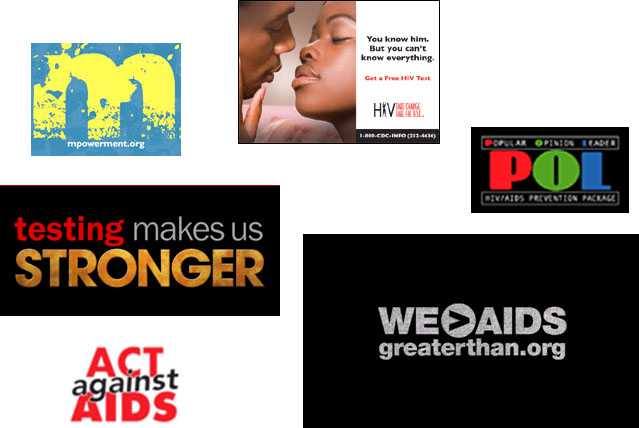
Social marketing campaigns and community-level interventions
In Year 1 (October 2010 to September 2011), a variety of social marketing campaigns that promoted HIV prevention/sexual health information and raised awareness about HIV prevention services were conducted in the 12 ECHPP areas. The campaigns targeted one or more high-risk populations (e.g., MSM, HIV-positive persons, transgender persons, African Americans). Examples include national campaigns like Greater Than AIDS and local campaigns to support national HIV/AIDS awareness days. These campaigns resulted in an estimated 143,365,223 impressions or exposures to HIV prevention messages in the 12 ECHPP MSAs. Community-level interventions typically involved community-wide HIV testing events and implementation of behavioral risk reduction interventions, such as adaptations of Popular Opinion Leader and Mpowerment. These interventions are not expected to have the same reach as the social marketing campaigns. An estimated 73,461 people were exposed to community-level interventions in the 12 ECHPP areas during the reporting period.
Additional ECHPP process data
Quantitative and qualitative data associated with other ECHPP activities (e.g., perinatal transmission interventions; HIV testing; and policy, systems, and environmental interventions) will be described on this website in the near future once processing is complete.
Improvements in data reporting capacity at health departments
The programmatic data reported by grantees are useful in understanding health department service coverage and reach during the first year of ECHPP. Additionally, this is the first time that CDC has been in a position to report on health department-supported programmatic activities that occur in high-prevalence areas that are supported by multiple public and private funding sources. The ECHPP grantees were successful in reporting data for the majority of the core process measures and in identifying strategies to improve their reporting capacity across a variety of measures. CDC expects grantee reporting capacity in these 12 MSAs to improve throughout the project period as agency infrastructure and partnerships continue to develop. Strategies to improve data reporting capacity have included building new partnerships within the health departments, addressing data sharing barriers (across offices within the health departments and when accessing data from other service providers), and developing streamlined systems to better monitor health department programs and services.
Parallel to the efforts by ECHPP grantees, CDC is collaborating with other federal agencies to obtain HIV-related programmatic data directly for these areas. For example, programmatic data related to HIV testing and comprehensive prevention services for HIV-positive people that may be available at Health Resources and Services Administration and Substance Abuse and Mental Health Services Administration have been identified and requested by CDC for the evaluation baseline period (2008 to 2010). Ultimately, the goal of this cross-agency effort is to continue to decrease the reporting burden for publicly funded grantees by improving data sharing practices at the federal level.
- Page last reviewed: February 9, 2016
- Page last updated: February 9, 2016
- Content source: Division of HIV/AIDS Prevention, National Center for HIV/AIDS, Viral Hepatitis, STD, and TB Prevention, Centers for Disease Control and Prevention