

HIV in the United States: At A Glance
 ShareCompartir
Fast Facts
- 1.1 million people in the US are living with HIV, and 1 in 7 of them don’t know it.
- The estimated number of annual new HIV infections declined 10% from 2010 to 2014.
- Gay and bisexual men, particularly young African American gay and bisexual men, are most affected.
Annual HIV infectionsa and diagnosesb are declining in the United States. The declines may be due to targeted HIV prevention efforts. However, progress has been uneven, and annual infections and diagnoses have increased among a few groups, such as Hispanic/Latino gay and bisexual men.
HIV Infections
There were an estimated 37,600 new HIV infections in 2014.
- 26,200 (70%) were among gay and bisexual men.c
- 8,600 (23%) were among heterosexuals.
- 2,800 (7%) were among people who inject drugs (PWID) (includes 1,100 infections among gay and bisexual men who inject drugs).d
From 2010 to 2014:
- Among the overall population, the estimated number of annual HIV infections declined 10% (from 41,900 to 37,600).
- Among gay and bisexual men, trends varied by race and age:
- Among white gay and bisexual men, annual infections declined 11%.
- Among black/African Americane gay and bisexual men, annual infections remained stable.
- Among Hispanic/Latinof gay and bisexual men, annual infections increased 14%.
- Annual infections declined among gay and bisexual men aged 13-24 (16%) and 35-44 (16%), but increased 23% among gay and bisexual men aged 25-34.
- Among heterosexuals, annual infections declined 23%.
- Among PWID, annual infections declined 32%.
HIV Diagnoses
In 2015, 39,513 people received an HIV diagnosis. The annual number of HIV diagnoses fell 9% between 2010 and 2014.
Gay and bisexual men are the population most affected by HIV. In 2015:
- Gay and bisexual men accounted for 67% (26,376) of all HIV diagnoses and 82% of diagnoses among males.
- African American gay and bisexual men accounted for the largest number of HIV diagnoses (10,315), followed by white (7,570) and Hispanic/Latino (7,013) gay and bisexual men.
Trends have varied by race. From 2010 to 2014:
- Among white gay and bisexual men, diagnoses decreased 9%.
- Among African American gay and bisexual men, diagnoses increased 2%.
- After years of sharp increases, diagnoses among young African American gay and bisexual men (aged 13 to 24) declined 2%.
- Among Hispanic/Latino gay and bisexual men, diagnoses increased 13%.
Heterosexuals and PWID also continue to be affected by HIV. In 2015:
- Heterosexual contact accounted for 24% (9,339) of the diagnosed HIV infections.
- Women accounted for 19% (7,402) of HIV diagnoses (infections were primarily attributed to heterosexual contact [86%, or 6,391] or injection drug use [13%, or 980]).
- PWID accounted for 9% (3,594) of HIV diagnoses (includes 1,202 infections among gay and bisexual men who inject drugs).
From 2010 to 2014:
- Diagnoses among all women declined 20%, and among African American women, diagnoses declined 24%.
- Among all heterosexuals, diagnoses declined 19%, and among PWID, diagnoses declined 32%.
By race/ethnicity, African Americans and Hispanics/Latinos are disproportionately affected by HIV. In 2015:
- African Americans represented 12% of the population, but accounted for 45% (17,670) of HIV diagnoses. African Americans have the highest rate of HIV diagnoses compared to other races and ethnicities.
- Hispanics/Latinos represented 18% of the US population, but accounted for 24% (9,290) of HIV diagnoses.
Of people who received an HIV diagnosis in 2015, 4% (1,723) were aged 13-19, 37% (14,594) were aged 20-29, 24% (9,631) were aged 30-39, 17% (6,720) were aged 40-49, 12% (4,870) were aged 50-59, and 5% (1,855) were aged 60 and over.
HIV diagnoses are not evenly distributed geographically. The population rates (per 100,000 people) of people who received an HIV diagnosis were highest in the South (16.8), followed by the Northeast (11.6), the West (9.8), and the Midwest (7.6).g
New HIV Diagnoses in the United States for the Most-Affected Subpopulations, 2015
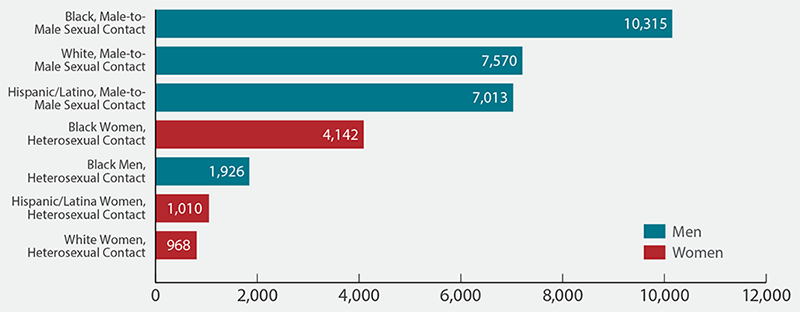
Source: CDC. Diagnoses of HIV infection in the United States and dependent areas, 2015. HIV Surveillance Report 2016;27. Subpopulations representing 2% or less of HIV diagnoses are not reflected in this chart.
Living With HIV
- An estimated 1,107,700 adults and adolescents were living with HIV at the end of 2014. Of those, 166,000 (15%) had not received a diagnosis.
- Young people were the most likely to be unaware of their infection. Among people aged 13-24 who were living with HIV, an estimated 44% didn’t know.
- In 2014, among all adults and adolescents living with HIV (diagnosed or undiagnosed), 62% received some HIV medical care, 48% were retained in continuous HIV care, and 49% were virally suppressed (having a very low level of the virus).h A person with a suppressed viral load can stay healthy and has a dramatically lower chance of transmitting the virus to others.
AIDS Diagnoses and Deaths
In 2015, 18,303 people received an AIDS diagnosis. Since the epidemic began in the early 1980s, 1,216,917 people have received an AIDS diagnosis.
In 2014, 6,721 deaths were attributed directly to HIV.
aEstimated annual HIV infections are the estimated number of new infections (HIV incidence) that occurred in a particular year, regardless of when those infections were diagnosed. Incidence data are not available for all subpopulations.
bHIV and AIDS diagnoses indicate when a person receives a diagnosis of HIV or AIDS, not when the person was infected.
c The term male-to-male sexual contact is used in CDC surveillance systems. It indicates a behavior that transmits HIV infection, not how individuals self-identify in terms of their sexuality. This fact sheet uses the term gay and bisexual men.
d In this fact sheet, PWID includes diagnoses attributed to injection drug use as well as those attributed to injection drug use and male-to-male sexual contact.
e Referred to as African American in this fact sheet.
f Hispanics/Latinos can be of any race.
g This fact sheet uses the regions defined by the US Census Bureau and used in CDC’s National HIV Surveillance System:
Northeast: CT, ME, MA, NH, NJ, NY, PA, RI, VT
Midwest: IL, IN, IA, KS, MI, MN, MO, NE, ND, OH, SD, WI
South: AL, AR, DE, DC, FL, GA, KY, LA, MD, MS, NC, OK, SC, TN, TX, VA, WV
West: AK, AZ, CA, CO, HI, ID, MT, NV, NM, OR, UT, WA, WY
h People are considered retained in care if they get two viral load or CD4 tests at least 3 months apart in a year. (CD4 cells are the cells in the body’s immune system that are destroyed by HIV.) Viral suppression is based on the most recent viral load test.
Bibliography
- CDC. Deaths: Final data for 2014. National Vital Statistics Reports 2016;65(4). Accessed May 26, 2017.
- CDC. Diagnoses of HIV infection in the United States and dependent areas, 2015. HIV Surveillance Report 2016;27.
- CDC. HIV incidence: Estimated annual infections in the U.S., 2008-2014 [fact sheet]. Accessed May 26, 2017.
- CDC. Monitoring selected national HIV prevention and care objectives by using HIV surveillance data—United States and 6 dependent areas—2015. HIV Surveillance Supplemental Report 2017;22(2).
- CDC. New HIV infections drop 18 percent in six years [press release]. Accessed May 26, 2017.
- CDC. State HIV prevention progress report, 2010-2013. December 2015.
- CDC. Trends in U.S. HIV diagnoses, 2005-2014 [fact sheet]. Accessed May 26, 2017.
Additional Resources
- CDC-INFO 1-800-CDC-INFO (232-4636)
- CDC HIV Website
- CDC Act Against AIDS Campaign
- CDC HIV Risk Reduction Tool (BETA)
- Page last reviewed: October 11, 2017
- Page last updated: October 11, 2017
- Content source: Division of HIV/AIDS Prevention, National Center for HIV/AIDS, Viral Hepatitis, STD, and TB Prevention, Centers for Disease Control and Prevention