

HIV in the United States by Geographic Distribution
 ShareCompartir
Fast Facts
- Rates of HIV and AIDS diagnoses are highest in the South.a
- The highest percentage of HIV diagnoses in the South, Northeast, and Midwest is among blacks/African Americans. b
- Hispanics/Latinosc have the highest percentage of HIV diagnoses in the West.
- The South lags behind other regions in most HIV prevention and care indicators.
In the United States, HIV diagnoses are not evenly distributed across states and regions. Southern states accounted for half of new HIV diagnoses in 2015, while making up 38% of the national population. In all regions of the United States, the majority of people who receive an HIV diagnosis live in urban areas. But in the South, 23% of new HIV diagnoses are in suburban and rural areas, and in the Midwest 20% are suburban or rural—higher proportions than in the North and West. The South’s larger and more geographically dispersed persons living with HIV creates unique challenges for prevention, treatment, and care.
Understanding the places and populations that are most affected by HIV and AIDS allows the federal government to allocate its resources to the geographic areas where they are needed most, while still supporting a basic level of HIV education and prevention for everyone across the country.
HIV Infectionsd
There were an estimated 37,600 new HIV infections in the United States in 2014. Southern states accounted for half of them.
HIV Diagnoses, by Race/Ethnicity, Region, and State
The rates (per 100,000 people) of HIV diagnoses in 2015 were 16.8 in the South, 11.6 in the Northeast, 9.8 in the West, and 7.6 in the Midwest.
Rates of HIV Diagnoses Among Adults and Adolescents in the US in 2015, by State
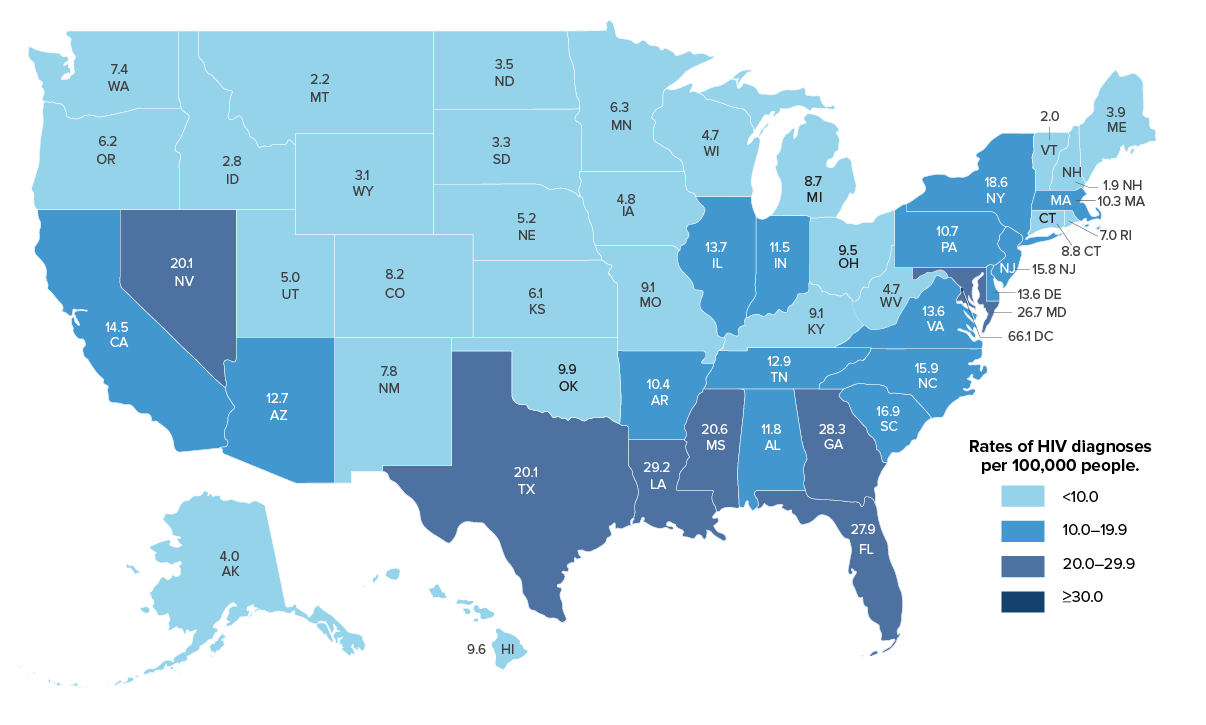
Source: CDC. Diagnoses of HIV infection in the United States and dependent areas, 2015. HIV Surveillance Report 2016;27.
Diagnoses of HIV Infection in the US in 2015, by Race/Ethnicity and Region of Residence
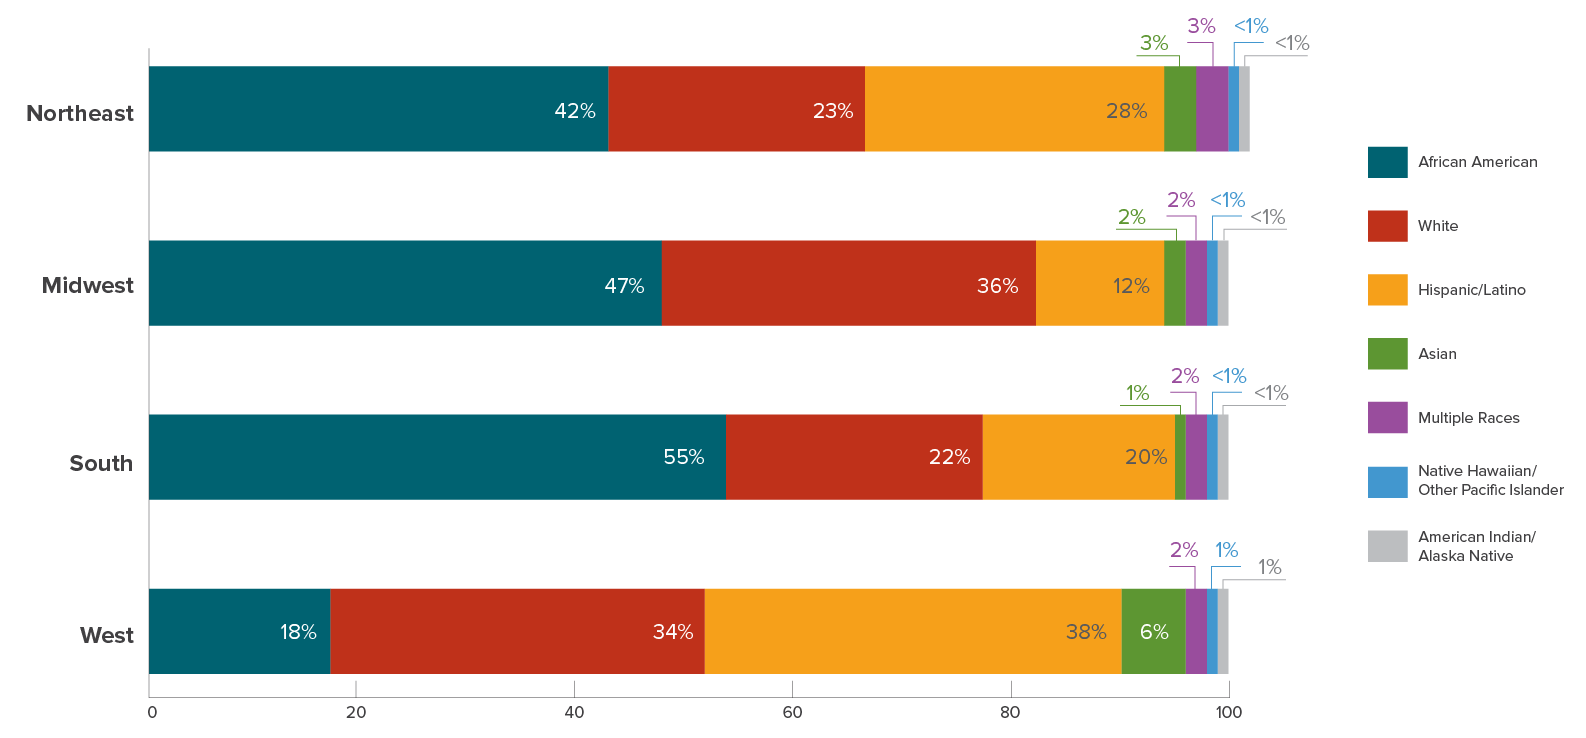
Source: CDC. Diagnoses of HIV infection in the United States and dependent areas, 2015. HIV Surveillance Report 2016;27.
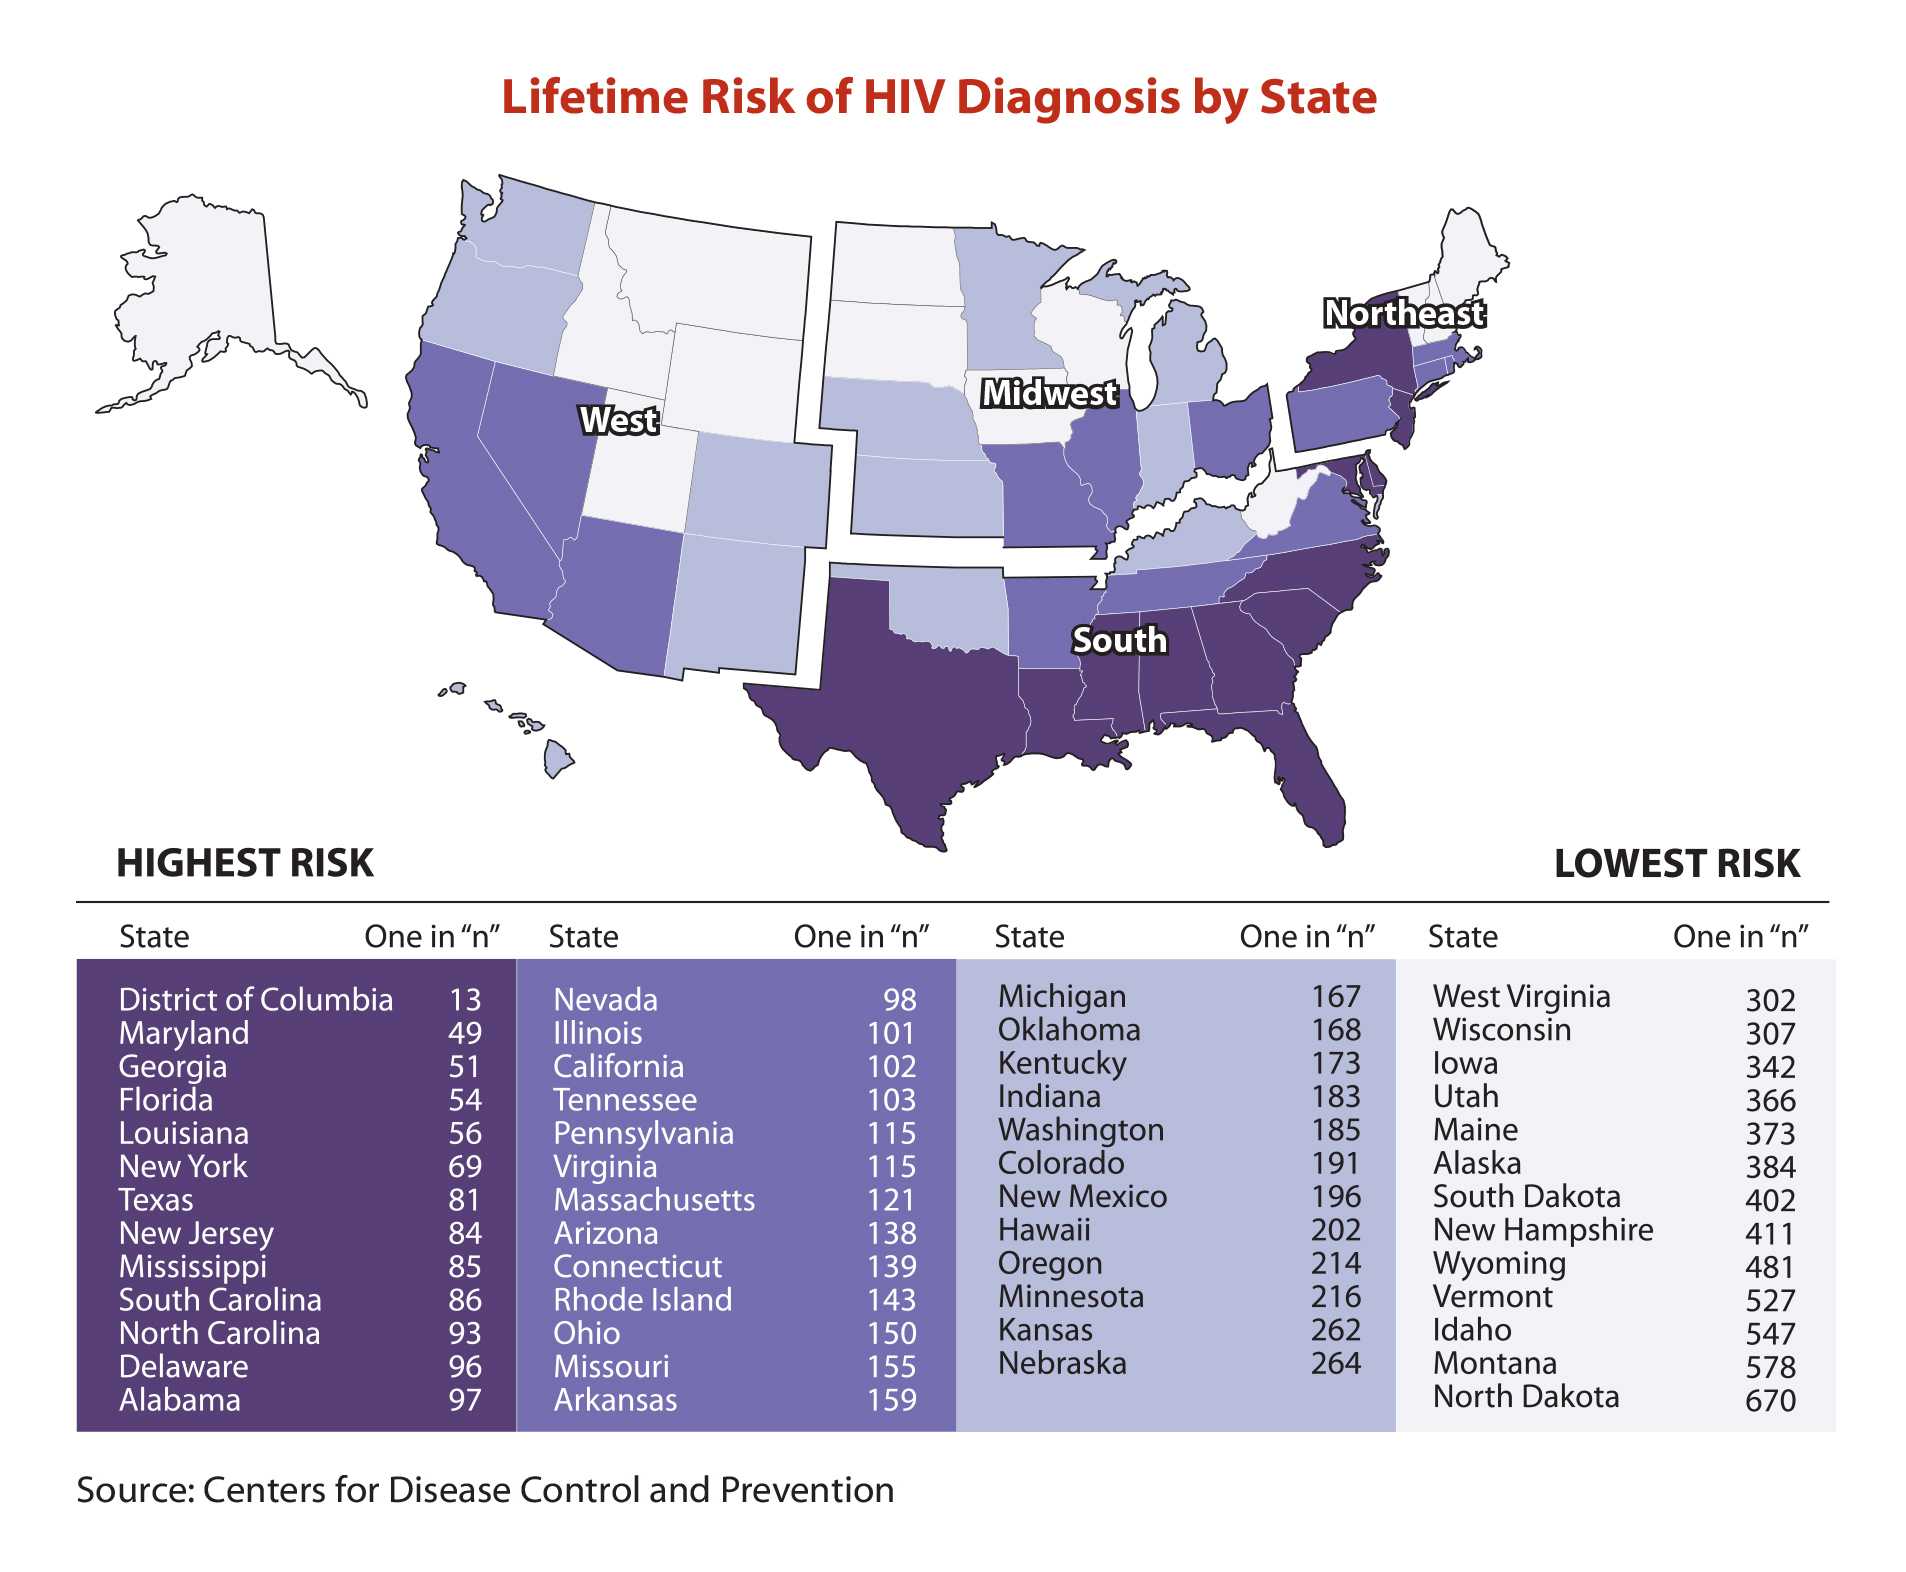
Lifetime Risk of HIV, by State
Overall, an American has a 1 in 99 chance of being diagnosed with HIV at some point in his or her life. But that lifetime risk is greater for people living in the South than in other regions of the country. The lifetime risk of HIV diagnosis is highest in the District of Columbia, followed by Maryland, Georgia, Florida, Louisiana, New York, Texas, New Jersey, Mississippi, South Carolina, North Carolina, Delaware, and Alabama.
Lifetime Risk of HIV Diagnosis, by State
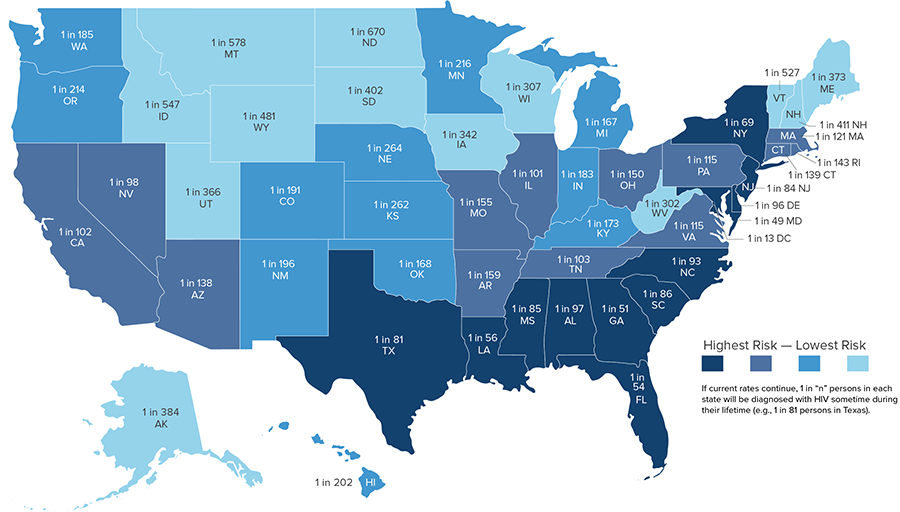
Source: CDC. Lifetime risk of HIV diagnosis(http://www.cdc.gov/nchhstp/newsroom/2016/croi-press-release-risk.html) [press release]. February 23, 2016.
Living With HIV, by Region
Southern states account for approximately 45% of all people living with an HIV diagnosis. States reporting the highest rates of people living with HIV are predominantly in the South and the Northeast. At the end of 2014, the overall prevalence rate of people living with diagnosed HIV infection in the United States was 299.5 per 100,000 people. By region, the prevalence rates were 419.5 in the Northeast, 352.5 in the South, 244.2 in the West, and 167.6 in the Midwest.
Knowledge of HIV status and the health of persons living with HIV vary widely across the United States, with Southern states generally behind other regions in some key HIV prevention and care indicators.
- Nationally, in 2014, 85% of people living with HIV knew they were HIV-positive. But 11 out of 17 Southern states fell below this mark.
- Linking people to care within 1 month after an HIV diagnosis improves their health and reduces the risk of transmission. Overall, 75% of people diagnosed in 2015 were linked to care within 1 month. Half the states that fell below that mark were in the South.e
- In some Southern states, people living with diagnosed HIV are 3 times as likely to die as those living with HIV in some other states.
AIDS, by Region
New AIDS diagnoses: In 2015, the South accounted for 52% (9,601) of the 18,303 new AIDS diagnoses in the United States, followed by the Northeast (18%, 3,328), the West (17%, 3,096), and the Midwest (12%, 2,278).
In 2015, the rate of new AIDS diagnoses was 7.9 in the South, 5.9 in the Northeast, 4.1 in the West, and 3.4 in the Midwest.
AIDS deaths: Of the 6,721 deaths attributed directly to HIV or AIDS in 2014, 3,570 (53%) were in the South, 1,279 (19%) were in the Northeast, 1,136 (17%) were in the West, and 736 (11%) were in the Midwest.
What CDC Is Doing
Because HIV prevalence and diagnoses are not evenly distributed across populations, CDC is pursuing a high-impact prevention approach to invest prevention resources in the places and populations most affected by HIV and maximize the effectiveness of HIV prevention efforts. For example,
-
Funding for state and local health departments is CDC’s most significant investment in HIV prevention. CDC allocates its HIV funding for health departments to closely align with the geographic areas and populations most affected by the epidemic.
- Starting in 2012, CDC has awarded at least $330 million each year ($343.7 million in 2015) to health departments to focus prevention efforts in communities and local areas where HIV is most heavily concentrated.
- A new health department demonstration project provides pre-exposure prophylaxis (PrEP) support services and data-to-care activities for gay and bisexual men and transgender persons of color who are at risk for or living with HIV in metropolitan areas with a high burden of the disease.
- CDC is awarding funds to community-based organizations to implement high-impact prevention programs in the geographic areas most affected by HIV.
Through its Act Against AIDS initiative, CDC provides effective and culturally appropriate prevention and treatment messages to reduce the HIV risk among the populations and communities most affected by the disease. Through Partnering and Communicating Together (PACT) to Act Against AIDS, CDC and organizations representing some of the populations hardest hit by HIV are raising awareness about testing, prevention, and retention in care.
a Regions defined by the US Census Bureau and used in CDC’s National HIV Surveillance System:
Northeast: CT, ME, MA, NH, NJ, NY, PA, RI, VT
Midwest: IL, IN, IA, KS, MI, MN, MO, NE, ND, OH, SD, WI
South: AL, AR, DE, DC, FL, GA, KY, LA, MD, MS, NC, OK, SC, TN, TX, VA, WV
West: AK, AZ, CA, CO, HI, ID, MT, NV, NM, OR, UT, WA, WY.
b Referred to as African American in this fact sheet.
c Hispanics/Latinos can be of any race.
d Estimated annual HIV infections are the estimated number of new infections (HIV incidence) that occurred in a particular year, regardless of when those infections were diagnosed. HIV and AIDS diagnoses refers to the number of people diagnosed with HIV infection and AIDS during a given time period, not when the people were infected.
e Restricted to 32 states and the District of Columbia with complete laboratory reporting.
Bibliography
- CDC. Monitoring selected national HIV prevention and care objectives by using HIV surveillance data—United States and 6 dependent areas—2015. HIV Surveillance Supplemental Report 2017;22(2).
- CDC. Diagnoses of HIV infection in the United States and dependent areas, 2015. HIV Surveillance Report 2016;27.
- CDC. Lifetime risk of HIV diagnosis [news release and graphics]. February 2016.
- CDC. State HIV prevention progress report, 2010-2013. December 2015.
- CDC. Deaths: Final Data for 2014. National Vital Statistics Reports 2016;65(4).
- CDC. HIV incidence: Estimated annual infections in the U.S., 2008-2014 [fact sheet]. Accessed August 29, 2017.
- CDC. High-impact HIV prevention: CDC’s approach to reducing HIV infections in the United States. Accessed August 29, 2017.
- Page last reviewed: September 20, 2017
- Page last updated: September 20, 2017
- Content source: Division of HIV/AIDS Prevention, National Center for HIV/AIDS, Viral Hepatitis, STD, and TB Prevention, Centers for Disease Control and Prevention