கார்பனீராக்சைடு வெளியீடு அடிப்படையில் நாடுகளின் பட்டியல்
இது ஒரு கார்பனீராக்சைடு வெளியீடு அடிப்படையில் நாடுகளின் பட்டியல் ஆகும். பின்வரும் பட்டியல் 2010 ஆம் ஆண்டு தரவின்படி அமைந்துள்ளது. இதில் புதைபடிவ எரிமம் பற்ற வைத்தல், சீமைக்காரை உற்பத்தி ஆகியன மூலம் வெளியிடப்படும் கார்பனீராக்சைடு ஆகியன கருத்திலெடுக்கப்பட்டுள்ளது. நிலப்பாவனை, நிலப்பாவனை மாற்றம், காடுகள் என்பன இதில் உள்ளடங்கவில்லை. கடற் கலங்கள் வெளியிடும் கார்பனீராக்சைடு தேசிய எண்ணிக்கையில் உள்வாங்கப்படவில்லை.[1]

Countries by carbon dioxide emissions in thousands of tonnes per annum, via the burning of fossil fuels (blue the highest).
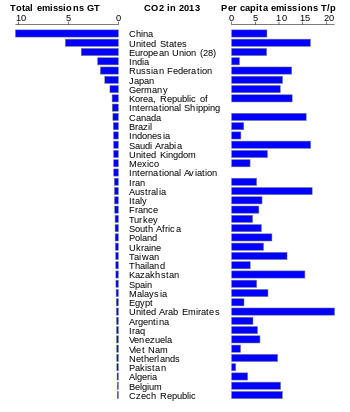
Carbon dioxide emissions for the top 40 countries by total emissions in 2013, given as totals and per capita. Data from EU Edgar database

The cumulative CO2 emissions between 1970 and 2013 from the top 40 countries in the world, including some extra-national bodies. The data comes from the EU EDGAR database

China CO2 emission in millions of tonnes from 1980 to 2009.
முதல் 10 நாடுகள் உலக மொத்தத்தில் 69% வெளிவிடுகின்றன.[2][3][4][5][6] மெத்தேன் உட்பட்ட பைங்குடில் வளிமம் போன்றவை இத்தரவினுள் உள்வாங்கப்படவில்லை.
பட்டியல் 2010 CO2 வெளியீடுகள்
| Country | Annual CO2 emissions (kt)[7] | per capita (t)[8] | % of world total |
|---|---|---|---|
| 8236 | 0.29 | 0.02% | |
| 4283 | 1.499 | 0.01% | |
| 123475 | 3.332 | 0.37% | |
| – | – | – | |
| 517 | 6.637 | % | |
| 30418 | 1.556 | 0.09% | |
| 513 | 5.885 | % | |
| Arab World | 1601122 | 4.604 | 4.76% |
| 180512 | 4.471 | 0.54% | |
| 4221 | 1.424 | 0.01% | |
| 2321 | 22.847 | 0.01% | |
| 373081 | 16.934 | 1.11% | |
| 66897 | 7.974 | 0.2% | |
| 45731 | 5.051 | 0.14% | |
| 2464 | 6.836 | 0.01% | |
| 24202 | 19.338 | 0.07% | |
| 56153 | 0.372 | 0.17% | |
| 1503 | 5.362 | % | |
| 62222 | 6.557 | 0.19% | |
| 108947 | 9.977 | 0.32% | |
| 422 | 1.367 | % | |
| 5189 | 0.546 | 0.02% | |
| 477 | 7.32 | % | |
| 477 | 0.665 | % | |
| 15456 | 1.522 | 0.05% | |
| 31125 | 8.093 | 0.09% | |
| 5233 | 2.657 | 0.02% | |
| 419754 | 2.15 | 1.25% | |
| 9160 | 22.868 | 0.03% | |
| 44679 | 6.041 | 0.13% | |
| 1683 | 0.108 | 0.01% | |
| 308 | 0.033 | % | |
| 356 | 0.729 | % | |
| 4180 | 0.291 | 0.01% | |
| 7235 | 0.351 | 0.02% | |
| 499137 | 14.678 | 1.48% | |
| Caribbean small states | 68085 | 9.894 | 0.2% |
| 590 | 10.636 | % | |
| 264 | 0.061 | % | |
| Central Europe and the Baltics | 714834 | 6.828 | 2.13% |
| 469 | 0.04 | % | |
| – | – | – | |
| 72258 | 4.213 | 0.21% | |
| 8286892 | 6.195 | 24.65% | |
| 75680 | 1.629 | 0.23% | |
| 139 | 0.204 | % | |
| 3040 | 0.049 | 0.01% | |
| 2028 | 0.493 | 0.01% | |
| 7770 | 1.664 | 0.02% | |
| 5805 | 0.306 | 0.02% | |
| 20884 | 4.727 | 0.06% | |
| 38364 | 3.401 | 0.11% | |
| வார்ப்புரு:CUW | – | – | – |
| 7708 | 6.984 | 0.02% | |
| 111752 | 10.669 | 0.33% | |
| 46303 | 8.346 | 0.14% | |
| 539 | 0.646 | % | |
| 136 | 1.906 | % | |
| 20964 | 2.093 | 0.06% | |
| East Asia & Pacific (all income levels) | 12042676 | 5.465 | 35.82% |
| East Asia & Pacific (developing only) | 9570523 | 4.874 | 28.47% |
| East Asia and the Pacific | – | – | – |
| 32636 | 2.176 | 0.1% | |
| 204776 | 2.623 | 0.61% | |
| 6249 | 1.005 | 0.02% | |
| 4679 | 6.721 | 0.01% | |
| 513 | 0.089 | % | |
| 18339 | 13.773 | 0.05% | |
| 6494 | 0.075 | 0.02% | |
| ஐரோ வலயம் | 2479985 | 7.445 | 7.38% |
| Europe & Central Asia (all income levels) | 6794446 | 7.641 | 20.21% |
| Europe & Central Asia (developing only) | 1416733 | 5.313 | 4.21% |
| Europe and Central Asia | – | – | – |
| 3709765 | 7.351 | 11.04% | |
| 711 | 14.348 | % | |
| 1291 | 1.5 | % | |
| 61844 | 11.531 | 0.18% | |
| Fragile and conflict affected situations | 358054 | 0.859 | 1.07% |
| 361273 | 5.556 | 1.07% | |
| 884 | 3.297 | % | |
| 2574 | 1.654 | 0.01% | |
| 473 | 0.281 | % | |
| 6241 | 1.402 | 0.02% | |
| 745384 | 9.115 | 2.22% | |
| 8999 | 0.371 | 0.03% | |
| 86717 | 7.775 | 0.26% | |
| 634 | 11.148 | % | |
| 260 | 2.487 | % | |
| – | – | – | |
| 11118 | 0.775 | 0.03% | |
| 1236 | 0.114 | % | |
| 238 | 0.15 | % | |
| 1701 | 2.164 | 0.01% | |
| 2120 | 0.214 | 0.01% | |
| Heavily indebted poor countries (HIPC) | 133288 | 0.214 | 0.4% |
| High income | 14901651 | 11.586 | 44.33% |
| High income: nonOECD | 3190425 | 12.973 | 9.49% |
| High income: OECD | 11799328 | 11.343 | 35.1% |
| 8108 | 1.064 | 0.02% | |
| 36289 | 5.166 | 0.11% | |
| 50583 | 5.058 | 0.15% | |
| 1962 | 6.169 | 0.01% | |
| 2008823 | 2.666 | 8.95% | |
| 433989 | 1.803 | 1.29% | |
| 571612 | 7.677 | 1.7% | |
| 114667 | 3.703 | 0.34% | |
| 40000 | 8.772 | 0.12% | |
| – | – | – | |
| 70656 | 9.268 | 0.21% | |
| 406307 | 6.854 | 1.21% | |
| 7158 | 2.66 | 0.02% | |
| 1170715 | 9.186 | 3.48% | |
| 20821 | 3.444 | 0.06% | |
| 248729 | 15.239 | 0.74% | |
| 12427 | 0.304 | 0.04% | |
| 62 | 0.638 | % | |
| 71624 | 2.923 | 0.21% | |
| 567567 | 11.487 | 1.69% | |
| – | – | – | |
| 93696 | 31.32 | 0.28% | |
| 6399 | 1.175 | 0.02% | |
| 1874 | 0.293 | 0.01% | |
| Latin America & Caribbean (all income levels) | 1733152 | 2.913 | 5.16% |
| Latin America & Caribbean (developing only) | 1553660 | 2.735 | 4.62% |
| Latin America and the Caribbean | – | – | – |
| Latin America and the Caribbean | – | – | – |
| 7616 | 3.631 | 0.02% | |
| Least developed countries: UN classification | 214256 | 0.255 | 0.64% |
| 20403 | 4.7 | 0.06% | |
| 18 | 0.009 | % | |
| 799 | 0.202 | % | |
| 59035 | 9.773 | 0.18% | |
| – | – | – | |
| 13561 | 4.378 | 0.04% | |
| Low & middle income | 16777539 | 2.997 | 49.91% |
| Low income | 222858 | 0.281 | 0.66% |
| Lower middle income | 3833446 | 1.565 | 11.4% |
| 10829 | 21.36 | 0.03% | |
| 1030 | 1.927 | % | |
| 10873 | 5.172 | 0.03% | |
| 2013 | 0.096 | 0.01% | |
| 1239 | 0.083 | % | |
| 216804 | 7.667 | 0.64% | |
| 1074 | 3.299 | % | |
| 623 | 0.045 | % | |
| 2589 | 6.246 | 0.01% | |
| 103 | 1.958 | % | |
| 2215 | 0.614 | 0.01% | |
| 4118 | 3.215 | 0.01% | |
| 443674 | 3.764 | 1.32% | |
| Mexico and Central America | – | – | – |
| 103 | 0.991 | % | |
| Middle East & North Africa (all income levels) | 2228843 | 5.855 | 6.63% |
| Middle East & North Africa (developing only) | 1277891 | 3.895 | 3.8% |
| Middle East and North Africa | – | – | – |
| Middle income | 16554874 | 3.447 | 49.25% |
| 4855 | 1.363 | 0.01% | |
| – | – | – | |
| 11511 | 4.243 | 0.03% | |
| 2582 | 4.163 | 0.01% | |
| 50608 | 1.599 | 0.15% | |
| 2882 | 0.12 | 0.01% | |
| 8995 | 0.173 | 0.03% | |
| 3176 | 1.457 | 0.01% | |
| 3755 | 0.14 | 0.01% | |
| 182078 | 10.958 | 0.54% | |
| 3920 | 15.68 | 0.01% | |
| 31551 | 7.224 | 0.09% | |
| 4547 | 0.781 | 0.01% | |
| 1412 | 0.089 | % | |
| 78910 | 0.494 | 0.23% | |
| வட அமெரிக்கா | 5932671 | 17.276 | 17.65% |
| – | – | – | |
| 57187 | 11.696 | 0.17% | |
| Not classified | – | – | – |
| பொருளியல் கூட்டுறவு மற்றும் வளர்ச்சிக்கான அமைப்பு அங்கத்தவர்கள் | 12591587 | 10.152 | 37.46% |
| 57202 | 20.409 | 0.17% | |
| பிற சிறிய நாடுகள் | 28761 | 1.502 | 0.09% |
| Pacific island small states | 2430 | 1.106 | 0.01% |
| 161396 | 0.932 | 0.48% | |
| 216 | 10.569 | % | |
| 9633 | 2.619 | 0.03% | |
| 3135 | 0.457 | 0.01% | |
| 5075 | 0.786 | 0.02% | |
| 57579 | 1.968 | 0.17% | |
| 81591 | 0.873 | 0.24% | |
| 317254 | 8.309 | 0.94% | |
| 52361 | 4.952 | 0.16% | |
| – | – | – | |
| 70531 | 40.31 | 0.21% | |
| 78745 | 3.889 | 0.23% | |
| 1740776 | 12.226 | 5.18% | |
| 594 | 0.055 | % | |
| 161 | 0.867 | % | |
| – | – | – | |
| 99 | 0.556 | % | |
| 464481 | 17.04 | 1.38% | |
| 7059 | 0.545 | 0.02% | |
| 45962 | 6.304 | 0.14% | |
| 704 | 7.843 | % | |
| 689 | 0.12 | % | |
| 13520 | 2.663 | 0.04% | |
| – | – | – | |
| 36094 | 6.695 | 0.11% | |
| 15328 | 7.482 | 0.05% | |
| Small states | 100070 | 3.545 | 0.3% |
| 202 | 0.383 | % | |
| 609 | 0.063 | % | |
| 460124 | 9.041 | 1.37% | |
| தெற்கு ஆசியா | – | – | – |
| South Asia | 2252623 | 1.402 | 6.7% |
| – | – | – | |
| Southern Cone Extended | – | – | – |
| 269675 | 5.79 | 0.8% | |
| 12710 | 0.615 | 0.04% | |
| 249 | 4.763 | % | |
| 403 | 2.274 | % | |
| – | – | – | |
| 209 | 1.912 | % | |
| Sub-Saharan Africa | – | – | – |
| Sub-Saharan Africa (all income levels) | 708444 | 0.819 | 2.11% |
| Sub-Saharan Africa (developing only) | 703762 | 0.815 | 2.09% |
| 14173 | 0.311 | 0.04% | |
| 2384 | 4.54 | 0.01% | |
| 1023 | 0.857 | % | |
| 52515 | 5.6 | 0.16% | |
| 38757 | 4.953 | 0.12% | |
| 61859 | 2.873 | 0.18% | |
| 2860 | 0.375 | 0.01% | |
| 6846 | 0.152 | 0.02% | |
| 295282 | 4.447 | 0.88% | |
| 183 | 0.172 | % | |
| 1540 | 0.244 | % | |
| 158 | 1.515 | % | |
| 50682 | 38.161 | 0.15% | |
| 25878 | 2.453 | 0.08% | |
| 298002 | 4.131 | 0.89% | |
| 53054 | 10.522 | 0.16% | |
| 161 | 5.206 | % | |
| – | – | – | |
| 3784 | 0.111 | 0.01% | |
| 304805 | 6.645 | 0.91% | |
| 167597 | 19.854 | 0.5% | |
| 493505 | 7.863 | 1.47% | |
| 5433057 | 17.564 | 16.16% | |
| Upper middle income | 12721087 | 5.404 | 37.84% |
| 6645 | 1.971 | 0.02% | |
| 104443 | 3.657 | 0.31% | |
| 117 | 0.497 | % | |
| 201747 | 6.946 | 0.6% | |
| 150230 | 1.728 | 0.45% | |
| – | – | – | |
| 2365 | 0.621 | 0.01% | |
| World | 33615389 | 4.883 | 100% |
| 21852 | 0.96 | 0.07% | |
| 2428 | 0.184 | 0.01% | |
| 9428 | 0.721 | 0.03% |
பட்டியல் - 2011 CO2 வெளியீடுகள் கணக்கீடு
| நாடு | வெளியீடு (kt)[9] | ஒருவருக்கான வெளியீடு (t)[10] |
|---|---|---|
| உலகம் | 33,376,327 | 4.9 |
| 9,700,000 | 7.2 | |
| 5,420,000 | 17.3 | |
| 1,970,000 | 1.6 | |
| 1,830,000 | 12.8 | |
| 1,240,000 | 9.8 | |
| பன்னாட்டு போக்குவரத்து | 1,040,000 | - |
| 810,000 | 9.9 | |
| 610,000 | 12.6 | |
| 560,000 | 16.2 |
பட்டியல் - 2012 CO2 வெளியீடுகள் கணக்கீடு
| நாடு | வெளியீடு (kt)[11] | ஒருவருக்கான வெளியீடு (t)[11] |
|---|---|---|
| உலகம் | 34,500,000 | 4.9 |
| 9,860,000 | 7.1 | |
| 5,190,000 | 16.4 | |
| 1,970,000 | 1.6 | |
| 1,770,000 | 12.4 | |
| 1,320,000 | 10.4 | |
| பன்னாட்டு போக்குவரத்து | 1,060,000 | - |
| 810,000 | 9.7 | |
| 640,000 | 13.0 | |
| 560,000 | 16.0 | |
| 490,000 | 7.7 | |
| 490,000 | 4.0 | |
| 490,000 | 2.0 | |
| 460,000 | 16.2 | |
| 460,000 | 2.3 | |
| 430,000 | 18.8 | |
| 410,000 | 5.3 | |
| 390,000 | 6.3 | |
| 370,000 | 5.8 | |
| 330,000 | 6.3 | |
| 320,000 | 8.4 |
பட்டியல் - 2013 வெளியீடு கணக்கீடு
| நாடு | வெளியீடு (kt)[12] | ஒருவருக்கான வெளியீடு (t)[12] |
|---|---|---|
| உலகம் | 35,270,000 | - |
| 10,330,000 | 7.4 | |
| 5,300,000 | 16.6 | |
| 3,740,000 | 7.3 | |
| 2,070,000 | 1.7 | |
| 1,800,000 | 12.6 | |
| 1,360,000 | 10.7 | |
| பன்னாட்டு போக்குவரத்து | 1,070,000 | - |
| 840,000 | 10.2 | |
| 630,000 | 12.7 | |
| 550,000 | 15.7 | |
| 510,000 | 2.6 | |
| 490,000 | 16.6 | |
| 480,000 | 2.0 | |
| 480,000 | 7.5 | |
| 470,000 | 3.9 | |
| 410,000 | 5.3 | |
| 390,000 | 16.9 | |
| 390,000 | 6.4 | |
| 370,000 | 5.7 | |
| 330,000 | 6.2 | |
| 320,000 | 8.5 |
உசாத்துணை
- Schrooten, L; De Vlieger, Ina; Int Panis, Luc; Styns, R. Torfs, K; Torfs, R (2008). "Inventory and forecasting of maritime emissions in the Belgian sea territory, an activity based emission model". Atmospheric Environment – 42(4)667-676(2008) 42 (4): 667–676.
- "China now no. 1 in CO2 emissions; USA in second position". Netherlands Environmental Assessment Agency. பார்த்த நாள் 2007-06-22.
- "China Overtakes U.S. as No. 1 Emitter of Carbon Dioxide". NPR. 2008-03-14. http://www.npr.org/templates/story/story.php?storyId=88251868.
- "China CO2 Emissions Growing Faster Than Anticipated". National Geographic. 2008-03-18. http://news.nationalgeographic.com/news/2008/03/080318-china-warming.html.
- "Forecasting the Path of China’s CO2 Emissions Using Province Level Information". Department of Agricultural & Resource Economics, UCB. CUDARE Working Paper 97. 2008-03-14. http://repositories.cdlib.org/cgi/viewcontent.cgi?article=1050&context=are_ucb.
- "China Passes U.S., Leads World in Power Sector Carbon Emissions – CGD". Center for Global Development. 2008-08-27. http://www.cgdev.org/content/article/detail/16578/.
- "CO2 emissions (kt)".
- "CO2 emissions per capita(kt)".
- EDGAR: CO2 time series 1990–2011 per region/country
- EDGAR: CO2 time series 1990–2011 per capita for world countries
- EDGAR: Trends in CO2 emissions per region/country 1990–2012 per region/country
- EDGAR: Trends in global CO2 emissions: 2014 report
வெளி இணைப்புகள்
The contents of this article comes from the latest figures from the millennium indicators as of 2009-07-14:
- United Nation Statistics Division
- GHG data from UNFCCC – United Nations Framework Convention on Climate Change GHG emissions data
- Breathing Earth – A visual real-time simulation that uses this CO2 emissions data
- Google – public data "CO2 emissions (kt)"
- Google – public data "CO2 emissions (tonne per capita)"
- World CO2 Emissions | Tableau Public
This article is issued from
Wikipedia.
The text is licensed under Creative
Commons - Attribution - Sharealike.
Additional terms may apply for the media files.