

Figure 49. Herpes Simplex Virus Type 2 — Seroprevalence Among Non-Hispanic Whites and Non-Hispanic Blacks by Sex and Age Group, National Health and Nutrition Examination Survey (NHANES), 1988–1994, 1999–2002, 2003–2006, and 2007–2010
 ShareCompartir
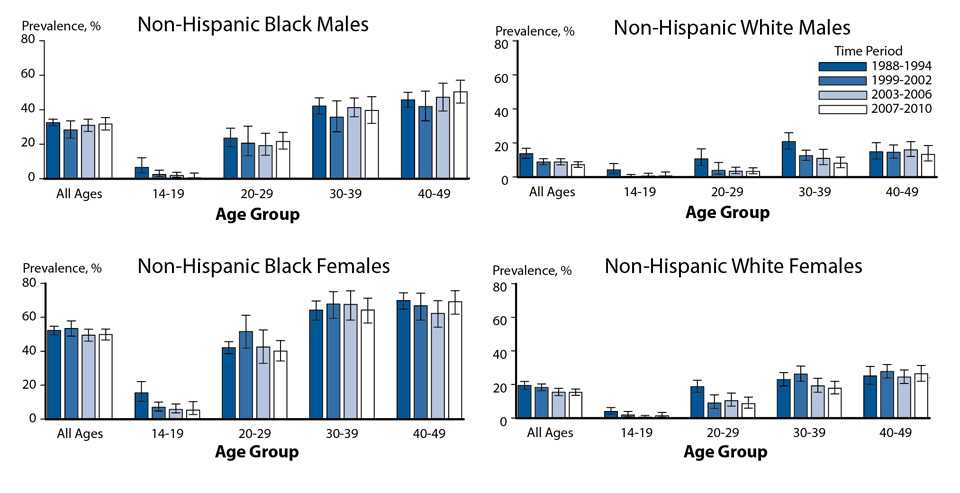
NOTE: Error bars indicate 95% confidence interval.
SOURCE: Fanfair RN, Zaidi A, Taylor LD, et al. Trends in seroprevalence of herpes simplex virus type 2 among Non-Hispanic Blacks and Non-Hispanic Whites aged 14 to 49 years — United States, 1988 to 2010. Sex Transm Dis 2013;40(11):860–4.
The data represented in this figure can be downloaded at www.cdc.gov/std/stats16/figures/OtherFigureData.zip.
- Page last reviewed: September 26, 2017
- Page last updated: September 26, 2017
- Content source: