

Figure 50. Trichomonas vaginalis and Other Vaginal Infections Among Females — Initial Visits to Physicians’ Offices, United States, 1966–2015
 ShareCompartir
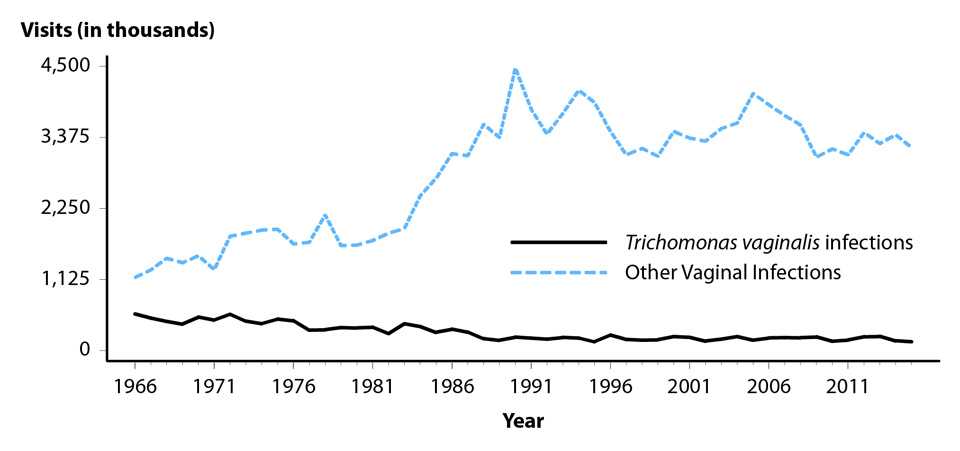
NOTE: The relative standard errors for Trichomonas vaginalis infection estimates range from 23% to 17% and for other vaginal infection estimates range from 13% to 8%. See Section A2.5 in the Appendix and Table 44.
SOURCE: National Disease and Therapeutic Index, IMS Health, Integrated Promotional Services™, IMS Health Report, 1966–2015. The 2016 data were not obtained in time to include them in this report.
- Page last reviewed: September 26, 2017
- Page last updated: September 26, 2017
- Content source: