

NPIN Site Metrics (Fiscal Year 2016)
 ShareCompartir
This section of the Dashboard contains metrics for the four major sites that are part of the National Prevention Information Network (NPIN). Using SiteCatalyst, metrics include page views, percent change from previous year (if available), the average time visitors spend, and external or internal sources.
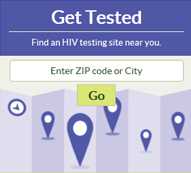
Get Tested
Overview
- 2,082,250 page views to the site
- Visitors spent an average of 4.2 minutes on the site
- 52% of traffic to the Get Tested site came from CDC.gov, 48% of the traffic came from other sources including 12% from Search Engines
Get Tested
Source: Adobe SiteCatalyst

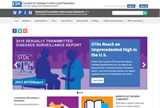
NPIN
Overview
- 865,950 page views to the site
- Visitors spent an average of 5.1 minutes on the site
- 34% of traffic to the Get Tested site came from CDC.gov, 66% of the traffic came from other sources including 13% from Search Engines
NPIN
Source: Adobe SiteCatalyst
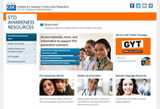
STD Awareness
Overview
- 229,890 page views to the site
- Visitors spent an average of 2.65 minutes on the site
- 47% of traffic to the Get Tested site came from CDC.gov, 53% of the traffic came from other sources including 16% from Search Engines
STD Awareness
Source: Adobe SiteCatalyst
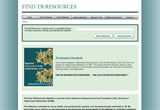
Find TB Resources
Overview
- 101,890 page views to the site
- Visitors spent an average of 5.4 minutes on the site
- 60% of traffic to the Get Tested site came from CDC.gov, 40% of the traffic came from other sources including 10% from Search Engines
Find TB Resources
Source: Adobe SiteCatalyst

- Page last reviewed: December 30, 2016
- Page last updated: December 30, 2016
- Content source: