2015 NCHHSTP Site Metrics
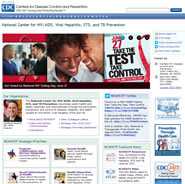
Welcome to the NCHHSTP Website Metrics Dashboard. This dashboard is updated each Fiscal Year with key metrics obtained using Adobe SiteCatalyst v. 15, detailing how visitors are interacting with NCHHSTP web sites. The Dashboard provides metrics reports such as page views, site rankings, traffic sources, and average time on site for each center, division, and cross-cutting site.
It is important to note that in 2014, the NCHHSTP metrics dashboard moved to a fiscal year reporting model. Prior years, found in the archive, were reported using an annual year model.
Annual Summary (October 1, 2014 - September 30, 2015)
Overview
- #3 most viewed division on CDC.gov with 102,463,172 page views* (comparable with 2014)
- 4 of the top 25 pages on CDC.gov
- 6 of the top 25 search keywords for CDC.gov
*What is a "Page View"? The Page View metric is defined as the number
of times a page has been loaded into a browser (including reloads).
Ranking of NCHHSTP Sites on CDC.gov**
- #1 CDC STDs (ranked #1 since 2011)
- #17 CDC Tuberculosis (2014 rank: #19)
- #18 CDC HIV/AIDS (2014 rank: #22)
- #28 CDC Viral Hepatitis (2014 rank: #32)
- #40 CDC DASH (2014 rank: #38)
** For CDC.gov site metrics overall, please see CDC eHealth Metrics Dashboard.
NCHHSTP Top 25 Pages on CDC.gov
Top 25 Search Keywords (External) for CDC.gov
- #5 hpv
- #6 chlamydia
- #12 herpes
- #13 hepatitis c
- #22 gonorrhea
- #23 tuberculosis
NCHHSTP Division Web Sites Page Views
| Division Web Sites | Page Views |
|---|---|
| STD Prevention | 69,019,283 |
| Tuberculosis Elimination | 11,966,934 |
| HIV/AIDS Prevention | 10,343,373 |
| Viral Hepatitis | 6,317,537 |
| Adolescent and School Health | 2,764,774 |
NCHHSTP Cross-Cutting Web Sites Page Views
| Cross-cutting Sites | Page Views |
|---|---|
| Condom Effectiveness | 428,775 |
| U.S. Public Health Service Syphilis Study at Tuskegee | 337,078 |
| Lesbian, Gay, Bisexual and Transgender Health | 319,575 |
| NCHHSTP Center | 317,632 |
| NCHHSTP Newsroom | 255,190 |
| Social Determinants of Health | 232,877 |
| Gay and Bisexual Men's Health (MSM) | 206,615 |
| NCHHSTP Atlas | 102,920 |
| Sexual Health | 54,026 |
| Correctional Health | 47,292 |
| Persons Who Use Drugs (PWUD) | 43,964 |
| Health Disparities | 40,303 |
| NCHHSTP State Health Profiles | 38,593 |
| Office of Infectious Diseases | 30,195 |
| Program Collaboration & Service Integration (PCSI) | 18,594 |
| Prevention Resources for Our Partners and Grantees | 17,971 |
| Prevention Through Health Care | 14,504 |
| Pregnancy and HIV, Viral Hepatitis, STD, and TB Prevention | 6,598 |
- Page last reviewed: December 30, 2016
- Page last updated: December 30, 2016
- Content source:


 ShareCompartir


