

NCHHSTP Site Metrics (Fiscal Year 2013)
 ShareCompartir
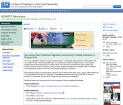
Center Site Overview
- 836,658 page views to the site, including the sub-sites NCHHSTP Newsroom and Strategic Priorities, an increase of 46% from 2012. Metrics for both sub-sites are below
- Visitors spent an average of 2.7 minutes on the site
- External sources* accounted for 29% of the traffic to the site while 71% of the traffic came from visitors that were already visiting CDC.gov and made their way to NCHHSTP
*(outside of CDC.gov including bookmarked, typed or saved URLs)
NCHHSTP
Source: Adobe SiteCatalyst

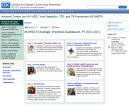
NCHHSTP Newsroom
Overview
- 209,826 page views to the site
- Visitors spent an average of 2.7 minutes on the site
- External sources* accounted for 52% of the traffic to the site while 48% of the traffic came from visitors that were already visiting CDC.gov and made their way to the NCHHSTP Newsroom site
*(outside of CDC.gov including bookmarked, typed or saved URLs)
NCHHSTP Newsroom
Source: Adobe SiteCatalyst
NCHHSTP Strategic Priorities
Overview
- 5,057 page views to the site, an increase of 81% from 2012
- Visitors spent an average of 2.7 minutes on the site
- External sources* accounted for 59% of the traffic to the site while 41% of the traffic came from visitors that were already visiting CDC.gov and made their way to the Strategic Priorities site
*(outside of CDC.gov including bookmarked, typed or saved URLs)
Strategic Priorities
Source: Adobe SiteCatalyst


- Page last reviewed: December 14, 2015
- Page last updated: December 14, 2015
- Content source: