

Sexually Transmitted Diseases (STD) Site Metrics
 ShareCompartir
http://www.cdc.gov/std/
Range: Jan 2010 - Dec 2010
Source: Omniture SiteCatalyst
Overview
- 35,558,826 page views to the site
- Visitors spent an average of 5.9 minutes on the site
- 91% of the traffic was from external sources (outside of CDC.gov including bookmarked, typed or saved URLs) while 9% was from within CDC.gov
Most Popular Pages
| Rank | Page Title | Page Views |
|---|---|---|
| 1 | STD Facts - Genital Herpes | 2,880,854 |
| 2 | STD Facts - Human papillomavirus (HPV) | 2,402,364 |
| 3 | Sexually Transmitted Diseases - Information from CDC | 2,349,170 |
| 4 | STD Facts - Chlamydia | 2,302,923 |
| 5 | STD Facts - Gonorrhea | 1,353,032 |
| 6 | Genital Herpes - STD information from CDC | 1,269,206 |
| 7 | Enfermedades de Transmisión Sexual | 1,173,808 |
| 8 | STD Facts - Syphilis | 1,083,104 |
| 9 | Chlamydia - STD information from CDC | 1,005,238 |
| 10 | STD Facts - Trichomoniasis | 761,879 |
Top Downloads
| Download Title | Page Views |
|---|---|
| What Women with a Positive HPV Test Result Should Know | 36,074 |
| MMWR Report: Sexually Transmitted Diseases Treatment Guidelines, 2006 | 33,975 |
| MMWR Report: Sexually Transmitted Diseases Treatment Guidelines, 2010 | 15,400 |
| What Patients Should Know When They Are Diagnosed with Genital Warts | 14,917 |
| Gonorrhea Fact Sheet | 13,118 |
| Sexually Transmitted Disease Surveillance 2008 | 11,439 |
| Herpes Fact Sheet (high resolution) | 10,490 |
| Herpes Fact Sheet (low resolution) | 10,484 |
| What Women Should Know Before They Get a Pap and HPV Test | 10,350 |
| Chlamydia Fact Sheet | 9,915 |
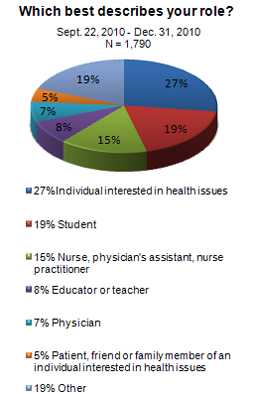
Sexually Transmitted Diseases Respondent Profile*
*Note: The date range for this data set is from September 22, 2010 to December 31, 2010.
Range: Sept. 22, 2010 - Dec. 31, 2010, N=1,790
Source: American Customer Satisfaction Survey (ACSI)
Customer Satisfaction
Customer Satisfaction Score was 83
(CDC.gov site Customer Satisfaction Score was 80)
Respondent Profile Summary
Age:
- 20-34 (33%)
- 35-49 (28%)
- 50-64 (23%)
Gender:
- Female (67%)
- Male (31%)
Education:
- Advanced degree (31%)
- College degree (31%)
- Some college (21%)
Frequency of visits:
- First time (38%)
- Couple of times a year (21%)
- Monthly (18%)
- Weekly (16%)
Reason for visit:
- Health information for work (33%)
- Health information for myself (28%)
- Other – generally school related (19%)
- Health information for patient or client (10%)
Type of information they were looking for:
- Sexually transmitted diseases (51%)
- Diseases and conditions (14%)
- Data and statistics (13%)
- Disease prevention (8%)
How they found site:
- Search engine (57%)
- Other – CDC awareness (13%)
- Referral links from other sites (11%)
Activities after using site:
- Talk to friend or family about topic (39%)
- Additional research online (37%)
- Print and share (36%)
Behavioral changes based on experience with site:
- “Likely” or “Very Likely” to do something different to improve their health based on their experience with the site (71%)
Most common changes:
- Be more aware, cautious (30%)
- Reduce risky sexual behavior (26%)
- Get tested (13%)
- Change diet, eating or exercise (13%)
Social media activities in last 3 months:
- Receive text messages via mobile phone (53%)
- Send text messages via mobile phone (53%)
- Watch videos on a websites (46%)
- Participate in online social network (46%)
- Use personalized web pages (34%)
- Browse websites using mobile device (33%)
- Browse through photo galleries (33%)
Viewed CDC website on mobile phone:
- Yes (7%)
- No (93%)

- Page last reviewed: April 19, 2011
- Page last updated: June 4, 2013
- Content source: