

NCHHSTP Cross-cutting Site Metrics (Fiscal Year 2015)
 ShareCompartir
On This Page
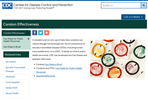
Condom Effectiveness
- 428,775 page views to the site, a decrease of 6% from 2014
- Visitors spent an average of 3.3 minutes on the site
- External sources* accounted for 89% of the traffic to the site while 11% of the traffic came from visitors that were already visiting CDC.gov and made their way to the Condom Effectiveness site
*(outside of CDC.gov including bookmarked, typed or saved URLs)
Condom Effectiveness
Source: Adobe SiteCatalyst
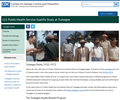
U.S. Public Health Service Syphilis Study at Tuskegee
- 337,078 page views to the site, an increase of 46% from 2014
- Visitors spent an average of 8.8 minutes on the site
- External sources* accounted for 74% of the traffic to the site while 26% of the traffic came from visitors that were already visiting CDC.gov and made their way to the U.S. Public Health Service Syphilis Study at Tuskegee site
*(outside of CDC.gov including bookmarked, typed or saved URLs)
Public Health Service Syphilis Study at Tuskegee
Source: Adobe SiteCatalyst
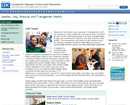
Lesbian, Gay, Bisexual and Transgender Health
- 319,575 page views to the site, an increase of 48% from 2014
- Visitors spent an average of 2.8 minutes on the site
- External sources* accounted for 65% of the traffic to the site while 38% of the traffic came from visitors that were already visiting CDC.gov and made their way to the Lesbian, Gay, Bisexual and Transgender Health site
*(outside of CDC.gov including bookmarked, typed or saved URLs)
Lesbian, Gay, Bisexual and Transgender Health
Source: Adobe SiteCatalyst
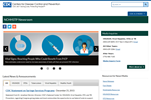
NCHHSTP Newsroom
- 255,190 page views to the site, an decrease of 7% from 2014
- Visitors spent an average of 3.5 minutes on the site
- External sources* accounted for 71% of the traffic to the site while 29% of the traffic came from visitors that were already visiting CDC.gov and made their way to the NCHHSTP Newsroom site
*(outside of CDC.gov including bookmarked, typed or saved URLs)
NCHHSTP Newsroom
Source: Adobe SiteCatalyst
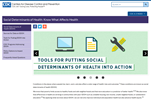
Social Determinants of Health
- 232,877 page views to the site, an increase of 14% from 2014
- Visitors spent an average of 5.8 minutes on the site
- External sources* accounted for 82% of the traffic to the site while 18% of the traffic came from visitors that were already visiting CDC.gov and made their way to the Social Determinants of Health site
*(outside of CDC.gov including bookmarked, typed or saved URLs)
Social Determinants of Health
Source: Adobe SiteCatalyst
Gay and Bisexual Men's Health (MSM)
- 206,615 page views to the site, an increase of 26% from 2014
- Visitors spent an average of 2 minutes on the site
- External sources* accounted for 57% of the traffic to the site while 43% of the traffic came from visitors that were already visiting CDC.gov and made their way to the Gay and Bisexual Men's Health (MSM) site
*(outside of CDC.gov including bookmarked, typed or saved URLs)
Gay and Bisexual Men's Health (MSM)
Source: Adobe SiteCatalyst
NCHHSTP Atlas
- 102,920 page views to the site, an increase of 5% from 2014
- Visitors spent an average of 3.2 minutes on the site
- External sources* accounted for 49% of the traffic to the site while 51% of the traffic came from visitors that were already visiting CDC.gov and made their way to the NCHHSTP Atlas site
*(outside of CDC.gov including bookmarked, typed or saved URLs)
NCHHSTP Atlas
Source: Adobe SiteCatalyst
Sexual Health
- 54,026 page views to the site, a decrease of 9% from 2014
- Visitors spent an average of 1.7 minutes on the site
- External sources* accounted for 53% of the traffic to the site while 47% of the traffic came from visitors that were already visiting CDC.gov and made their way to the Sexual Health site
*(outside of CDC.gov including bookmarked, typed or saved URLs)
Sexual Health
Source: Adobe SiteCatalyst
Correctional Health
- 47,292 page views to the site, comparable with 2014
- Visitors spent an average of 2.8 minutes on the site
- External sources* accounted for 49% of the traffic to the site while 51% of the traffic came from visitors that were already visiting CDC.gov and made their way to the Correctional Health site
*(outside of CDC.gov including bookmarked, typed or saved URLs)
Correctional Health
Source: Adobe SiteCatalyst
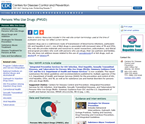
Persons Who Use Drugs (PWUD)
- 43,964 page views to the site, a decrease of 9% from 2014
- Visitors spent an average of 2.6 minutes on the site
- External sources* accounted for 40% of the traffic to the site while 60% of the traffic came from visitors that were already visiting CDC.gov and made their way to the Persons Who Use Drugs (PWUD) site
*(outside of CDC.gov including bookmarked, typed or saved URLs)
Persons Who Use Drugs (PWUD)
Source: Adobe SiteCatalyst
Health Disparities
- 40,303 page views to the site, a increase of 9% from 2014
- Visitors spent an average of 3.6 minutes on the site
- External sources* accounted for 84% of the traffic to the site while 16% of the traffic came from visitors that were already visiting CDC.gov and made their way to the Health Disparities site
*(outside of CDC.gov including bookmarked, typed or saved URLs)
Health Disparities
Source: Adobe SiteCatalyst
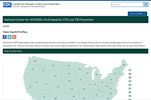
NCHHSTP State Health Profiles
- 38,593 page views to the site, a decrease of 21% from 2014
- Visitors spent an average of 3.2 minutes on the site
- External sources* accounted for 52% of the traffic to the site while 48% of the traffic came from visitors that were already visiting CDC.gov and made their way to the NCHHSTP State Health Profiles site
*(outside of CDC.gov including bookmarked, typed or saved URLs)
NCHHSTP State Health Profiles
Source: Adobe SiteCatalyst
Office of Infectious Diseases
- 30,195 page views to the site, a increase of 28% from 2014
- Visitors spent an average of 2.3 minutes on the site
- External sources* accounted for 50% of the traffic to the site while 50% of the traffic came from visitors that were already visiting CDC.gov and made their way to the Office of Infectious Diseases site
*(outside of CDC.gov including bookmarked, typed or saved URLs)
Office of Infectious Diseases
Source: Adobe SiteCatalyst
NCHHSTP Program Collaboration & Service Integration (PCSI)
- 18,594 page views to the site, a decrease of 42% from 2014
- Visitors spent an average of 3 minutes on the site
- External sources* accounted for 47% of the traffic to the site while 53% of the traffic came from visitors that were already visiting CDC.gov and made their way to the NCHHSTP Program Collaboration & Service Integration (PCSI) site
*(outside of CDC.gov including bookmarked, typed or saved URLs)
NCHHSTP Program Collaboration & Service Integration (PCSI)
Source: Adobe SiteCatalyst
NCHHSTP Prevention Resources for Our Partners and Grantees Site
- 17,971 page views to the site, an increase of 16% from 2014
- Visitors spent an average of 3.6 minutes on the site
- External sources* accounted for 61% of the traffic to the site while 39% of the traffic came from visitors that were already visiting CDC.gov and made their way to the Prevention Resources for Our Partners and Grantees site
*(outside of CDC.gov including bookmarked, typed or saved URLs)
NCHHSTP Prevention Resources for Our Partners and Grantees Site
Source: Adobe SiteCatalyst
Prevention Through Health Care
- 14,504 page views to the site, an increase of 68% from 2014
- Visitors spent an average of 3.6 minutes on the site
- External sources* accounted for 83% of the traffic to the site while 17% of the traffic came from visitors that were already visiting CDC.gov and made their way to the Prevention Resources for Our Partners and Grantees site
*(outside of CDC.gov including bookmarked, typed or saved URLs)
Prevention Through Health Care
Source: Adobe SiteCatalyst
Pregnancy and HIV, Viral Hepatitis, STD, and TB Prevention
- 6,598 page views to the site, a decrease of 31% from 2014
- Visitors spent an average of 0.7 minutes on the site
- External sources* accounted for 11% of the traffic to the site while 89% of the traffic came from visitors that were already visiting CDC.gov and made their way to the Pregnancy and HIV, Viral Hepatitis, STD, and TB Prevention site.
*(outside of CDC.gov including bookmarked, typed or saved URLs)
Pregnancy and HIV, Viral Hepatitis, STD, and TB Prevention
Source: Adobe SiteCatalyst

- Page last reviewed: December 30, 2016
- Page last updated: December 30, 2016
- Content source: