

Tuberculosis Site Metrics
 ShareCompartir
http://www.cdc.gov/tb/
Range: Jan 2010 - Dec 2010
Source: Omniture SiteCatalyst
Overview
- 5,355,932 page views to the site
- Visitors spent an average of 5.7 minutes on the site
- 67% of the traffic was from external sources (outside of CDC.gov including bookmarked, typed or saved URLs) while 33% was from within CDC.gov
Most Popular Pages
| Rank | Page Title | Page Views |
|---|---|---|
| 1 | CDC - Tuberculosis (TB) | 683,872 |
| 2 | CDC | TB | Basic TB Facts | 270,610 |
| 3 | CDC | TB | Testing & Diagnosis | 200,797 |
| 4 | CDC | TB | Treatment | 129,275 |
| 5 | CDC | TB | Fact Sheets - Tuberculin Skin Testing for TB | 111,932 |
| 6 | CDC | TB | TB Guidelines - Infection Control & Prevention | 92,445 |
| 7 | CDC | TB | TB Guidelines by Topic | 73,606 |
| 8 | CDC | TB | Infection Control and Prevention | 72,253 |
| 9 | CDC | TB | Data and Statistics | 67,116 |
| 10 | CDC | TB | Fact Sheets – BCG Vaccine | 66,782 |
Top Downloads
| Download Title | Page Views |
|---|---|
| What You Need to Know About the TB Skin Test | 7,356 |
| Tuberculin Skin Testing | 7,273 |
| Get the Facts About TB Disease | 7,170 |
| Reported Tuberculosis in the United States, 2008 | 6,432 |
| Tuberculosis: General Information | 5,756 |
| What You Need to Know About TB Infection | 4,992 |
| Self-Study Modules on Tuberculosis, 1-5 | 4,666 |
| Appendix B. Tuberculosis (TB) Risk Assessment Worksheet | 4,442 |
| Mantoux Tuberculin Skin Test | 4,383 |
| Morbidity Trend Tables United States | 4,349 |
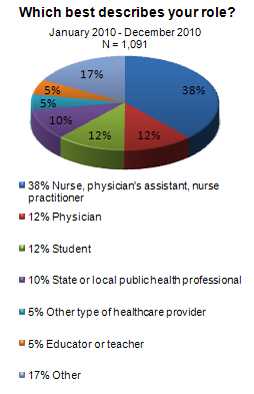
Respondent Profile Summary
Age:
- 50-64 (43%)
- 35-49 (33%)
- 20-34 (18%)
Gender:
- Male (22%)
- Female (76%)
Education:
- College degree (42%)
- Advanced degree (41%)
Frequency of visits :
- Weekly (30%)
- Monthly (28%)
- Couple of times a year (22%)
- First time (13%)
Reason for visit:
- Health information for work (63%)
- Other – generally school related (15%)
- Health information for patient or client (12%)
Type of information they were looking for:
- Diseases and conditions (24%)
- Professional training/education materials (17%)
- Disease prevention (13%)
- Data and statistics (10%)
- Other – guidelines, information “2 test” protocols (7%)
- Training (6%)
- Workplace safety and health (5%)
How they found site:
- Search engine (39%)
- Other – CDC awareness, work resource (17%)
- Referral links from other sites (15%)
- Bookmark (14%)
Activities after using site:
- Print and share (50%)
- Additional research online (39%)
- Bookmark (31%)
Behavioral changes based on experience with site:
- “Likely” or “Very Likely” to do something different to improve their health based on their experience with the site (61%)
Most common changes:
- Be more aware, cautious (41%)
- Change diet, eating or exercise (18%)
- Other – generally non-patient responses (educate others) (10%)
- Get vaccinated/take medications (10%)
- Be calmer/more hopeful (8%)
Social media activities in last 3 months:
- Receive text messages via mobile phone (47%)
- Send text messages via mobile phone (47%)
- Watch videos on a website (44%)
- Sign up to receive emails from a website (38%)
- Participate in online social network (36%)
Viewed CDC website on mobile phone:
- Yes (8%)
- No (92%)

- Page last reviewed: April 19, 2011
- Page last updated: March 25, 2014
- Content source: